The Zoonomia Project: Decoding 240 Mammalian Genomes to Revolutionize Biomedical Research and Drug Discovery
This article explores the groundbreaking Zoonomia Project mammalian phylogeny, a genomic treasure trove constructed from 240 species.
The Zoonomia Project: Decoding 240 Mammalian Genomes to Revolutionize Biomedical Research and Drug Discovery
Abstract
This article explores the groundbreaking Zoonomia Project mammalian phylogeny, a genomic treasure trove constructed from 240 species. Tailored for researchers and drug development professionals, it provides a foundational understanding of this comparative genomic framework, details its methodologies for identifying functional elements and disease links, discusses analytical challenges and optimization strategies, and validates its power against other genomic resources. The synthesis offers a roadmap for leveraging evolutionary constraint to accelerate target identification, understand disease mechanisms, and translate comparative genomics into clinical innovation.
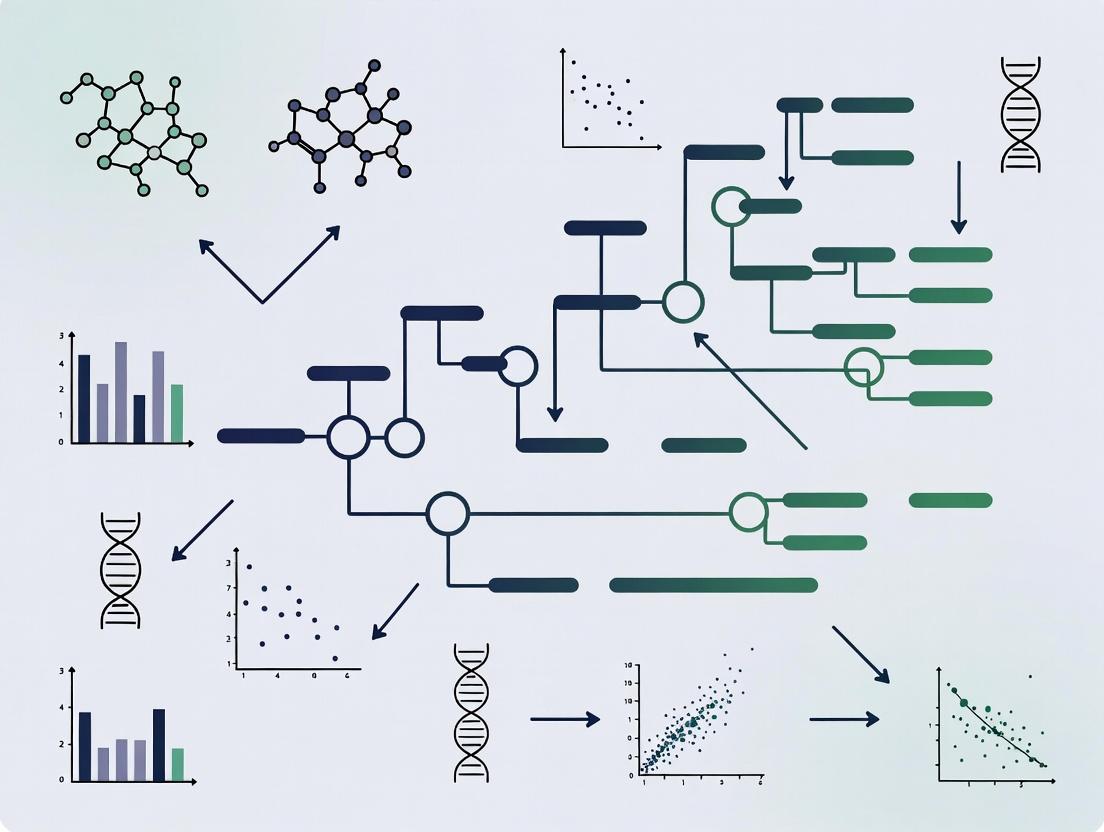
The Zoonomia Phylogenetic Tree: A Foundational Blueprint for Comparative Genomics
The Zoonomia Project constitutes the most comprehensive comparative genomics resource for placental mammals. Framed within the broader thesis of mammalian phylogeny tree exploration, its core objective is to leverage evolutionary constraint as a tool to decipher functional regions of the genome, elucidate the genetic basis of extraordinary mammalian traits, and inform human disease genetics and drug discovery. By analyzing the genomes of species spanning the mammalian tree of life, the project provides an unparalleled map of genomic elements evolutionarily conserved across over 100 million years, offering a powerful filter for identifying functionally critical regions.
Project Scope and Consortium
The Zoonomia Project is an international consortium of over 150 scientists across academia and industry. Its foundational scope is the generation and comparative analysis of high-coverage reference genomes for a phylogenetically diverse set of mammalian species.
Table 1: Zoonomia Project Quantitative Summary (Live Search Data)
| Metric | Value/Description |
|---|---|
| Total Species Analyzed | 240 placental mammals |
| Reference-Quality Genomes | 130+ high-coverage genomes assembled to chromosome level |
| Phylogenetic Coverage | >80% of mammalian families |
| Evolutionary Timespan | ~100 million years |
| Primary Data Source | Vertebrate Genomes Project (VGP), other biorepositories |
| Key Publications | Nature (2020), Science (2023) |
Core Objectives and Methodological Framework
Objective 1: Identify Evolutionarily Constrained Elements
- Rationale: Regions of the genome that have remained unchanged (constrained) across diverse mammals are likely to be functionally important.
- Experimental Protocol:
- Genome Alignment: Whole genomes are aligned using progressive Cactus, a reference-free, genome-wide aligner capable of handling evolutionary distances.
- Phylogenetic Modeling: A maximum likelihood phylogeny is inferred from the alignments using tools like RAxML or RevBayes, incorporating fossil calibrations for dating.
- Constraint Detection: PhyloP and PhastCons algorithms are applied to the multi-species alignment and phylogeny to quantify evolutionary constraint at each base-pair position, identifying conserved non-coding elements (CNEs), exons, and regulatory sites.
Objective 2: Link Genetic Variation to Phenotypic Diversity
- Rationale: Correlating lineage-specific genetic changes with clade-specific traits (e.g., hibernation, olfactory acuity, cancer resistance) reveals candidate functional variants.
- Experimental Protocol:
- Phenotype Data Curation: Quantitative and categorical phenotypes (e.g., brain mass, longevity, metabolic rate) are compiled from literature and databases.
- Phylogenetic Comparative Methods: Using the Zoonomia phylogeny, methods like Phylogenetic Generalized Least Squares (PGLS) are employed to control for evolutionary relationships.
- Genome-Wide Association (GWA) Across Species: Tools like SURF (Evolutionarily Conserved Regions) or RERconverge are used to perform GWA scans across the phylogeny, identifying branches or genes with evolutionary rates correlated with trait evolution.
Objective 3: Annotate Human Disease Variants via Evolutionary Constraint
- Rationale: Evolutionary conservation provides critical evidence for variant pathogenicity. Constrained positions are enriched for disease-causing mutations.
- Experimental Protocol:
- Constraint Metric Calculation: Generate a per-base "constrained score" (e.g., a Zoonomia Conservation Score) for the human genome based on the multi-species alignment.
- Variant Overlay & Prioritization: Annotate human variants from clinical cohorts (e.g., gnomAD, ClinVar) with the constraint score. Variants in highly constrained positions are prioritized for functional validation.
- In Silico Saturation Mutagenesis: Use models like EVE (Evolutionary model of Variant Effect) trained on Zoonomia alignments to predict pathogenicity of missense variants of unknown significance (VUS).
Visualizing Core Workflows and Pathways
Title: Zoonomia Project Core Analytical Workflow
Title: Evolutionary Constraint Scoring Logic
The Scientist's Toolkit: Key Research Reagent Solutions
Table 2: Essential Resources for Zoonomia-Based Research
| Resource/Solution | Function/Application |
|---|---|
| Zoonomia Cactus Alignments (UCSC Genome Browser) | Pre-computed whole-genome alignments for comparative genomics and conservation scoring. |
| Zoonomia Constraint Scores (bigWig files) | Genome tracks of evolutionary constraint for variant annotation and functional element prediction. |
| Zoonomia Mammalian Phylogeny (Newick file) | Time-calibrated species tree essential for phylogenetic comparative methods (PCMs). |
| RERconverge R Package | Software for identifying convergent and lineage-specific evolutionary rate shifts associated with traits. |
| PhyloP/PhastCons Software (PHAST package) | Core algorithms for calculating evolutionary conservation and acceleration from alignments. |
| EVE (Evolutionary Variant Effect) Model | An unsupervised machine learning model trained on Zoonomia alignments to predict pathogenicity of human missense variants. |
| VGP Genome Assemblies | High-quality reference genomes providing the foundational data for the entire project. |
| Zoonomia Phenotype Data Repository | Curated spreadsheet of species traits for correlation with genomic evolutionary rates. |
This whitepaper details the architectural framework and phylogenetic relationships resolved by the Zoonomia Consortium, a comparative genomics initiative analyzing the genomes of 240 extant mammalian species. The research establishes a robust, genome-wide phylogeny that serves as a foundational scaffold for exploring mammalian evolution, functional constraint, and the genetic basis of traits relevant to human health and disease. The phylogenetic "tree" is not merely a branching diagram but a precise, data-rich architecture enabling inferences about ancestral genomes, rates of evolution, and lineage-specific adaptations.
Phylogenetic Tree Construction: Data and Methodology
Genomic Dataset and Species Sampling
The core dataset comprises whole genomes from 240 placental mammal species, spanning over 80% of mammalian families. Key sampling criteria emphasized maximizing phylogenetic diversity and including species with unique biological traits (e.g., exceptional longevity, cancer resistance, metabolic adaptations).
Table 1: Summary of Genomic Data Input
| Data Category | Specification |
|---|---|
| Total Species | 240 |
| Mammalian Orders Represented | 21 of ~29 |
| Approx. Genome Coverage (mean) | >30X |
| Alignment Size (Zoonomia Cactus Alignment) | ~10.8 billion base pairs |
| Informative Sites for Phylogeny | Tens of millions |
Experimental & Computational Protocol for Tree Inference
Step 1: Multiple Genome Alignment
- Method: Progressive Cactus whole-genome aligner.
- Protocol: Genomes were aligned in a progressive manner guided by an initial guide tree. The resulting alignment captures orthologous regions across all 240 species, accounting for rearrangements and insertions/deletions.
- Output: A multi-species alignment in Hierarchical Alignment (HAL) format.
Step 2: Site Selection and Filtering
- Method: Phylogenetically informative, non-repetitive sites were extracted.
- Protocol: Mask repetitive elements (using RepeatMasker). Filter for four-fold degenerate synonymous sites (4D sites) and other conserved, neutral elements to minimize selective pressure bias.
- Output: A matrix of character states (A, C, G, T) for each filtered site across all taxa.
Step 3. Phylogenetic Inference
- Method: Maximum Likelihood (ML) using IQ-TREE 2 software.
- Protocol: Apply the GTR (General Time Reversible) model of nucleotide substitution with gamma-distributed rate heterogeneity (GTR+G). Perform extensive branch support analysis with 1000 ultrafast bootstrap replicates.
- Output: A time-calibrated, bifurcating phylogenetic tree with statistical support values for all nodes.
Step 4. Time Calibration
- Method: Bayesian dating using MCMCTree (PAML package).
- Protocol: Apply multiple fossil calibrations as minimum and/or maximum constraints on internal nodes (e.g., crown-group Euarchontoglires, Laurasiatheria). Run Markov Chain Monte Carlo (MCMC) chains to estimate divergence times.
- Output: A time-scaled ultrametric tree with node heights in millions of years.
Key Architectural Features of the 240-Species Tree
The resulting phylogeny resolves long-standing ambiguities in mammalian relationships and provides a high-resolution view of divergence times.
Table 2: Key Resolved Clades and Divergence Times
| Clade Name | Constituent Groups | Estimated Crown Age (MYA) | Bootstrap Support |
|---|---|---|---|
| Atlantogenata | Afrotheria + Xenarthra | ~90-100 | 100% |
| Boreoeutheria | Euarchontoglires + Laurasiatheria | ~85-95 | 100% |
| Euarchontoglires | Primates, Glires, Scandentia, Dermoptera | ~75-85 | 100% |
| Laurasiatheria | Eulipotyphla, Chiroptera, Ferae, Perissodactyla, Cetartiodactyla | ~75-85 | 100% |
| Glires | Rodentia + Lagomorpha | ~65-75 | 100% |
Application in Trait and Disease Genetics: A Workflow
The phylogenetic architecture is used as a comparative framework for genome-wide association studies (GWAS) across species—a method called Phylogenetic Analysis of Genome-Wide Associations (PAGWA).
Diagram 1: Phylogenetic trait mapping workflow.
The Scientist's Toolkit: Key Research Reagent Solutions
Table 3: Essential Materials for Phylogenomic Research
| Item / Reagent | Function in Research |
|---|---|
| High-Molecular-Weight DNA Kit (e.g., Qiagen MagAttract) | To extract ultra-pure DNA suitable for long-read and Hi-C sequencing from diverse tissue types. |
| Whole Genome Sequencing Service (Illumina NovaSeq, PacBio HiFi) | Generates the raw base pair data for de novo genome assembly and variant calling. |
| Cactus Whole-Genome Aligner | Software tool to create multiple genome alignments across evolutionary deep time, handling rearrangements. |
| IQ-TREE 2 Software | Maximum likelihood phylogenetic inference software capable of handling ultra-large genomic datasets. |
| MCMCTree (PAML) | Bayesian software for estimating divergence times on phylogenies using fossil calibration points. |
| Zoonomia Constrained Element Multiple Alignment | A pre-computed, publicly available alignment of conserved non-coding elements across 240 species, used as a neutral evolutionary backdrop. |
Signaling Pathway Analysis in an Evolutionary Context
The phylogenetic tree enables the reconstruction of ancestral gene sequences, allowing scientists to trace the molecular evolution of key signaling pathways and identify lineage-specific changes.
Diagram 2: Pathway evolution from ancestral state.
The phylogenetic architecture of 240 mammalian species, as constructed by the Zoonomia Consortium, provides an unprecedented and precise framework for decoding the functional genome. It transforms individual genomes into a connected network of evolutionary experiments, directly enabling the discovery of genetic elements underlying disease resistance, extreme phenotypes, and fundamental biological processes. This tree is not an endpoint but an essential tool for hypothesis generation and testing in comparative genomics and translational drug development.
The Zoonomia Project, through its comparative analysis of 240 mammalian genomes, provides an unprecedented framework for decoding the functional genome. This research leverages deep evolutionary history to distinguish functionally critical elements from neutral sequence. Within this phylogenetic context, the core concepts of evolutionary constraint, accelerated evolution, and deep conservation become powerful lenses for identifying genomic regions fundamental to mammalian biology, disease susceptibility, and potential therapeutic targets.
Core Conceptual Framework
Evolutionary Constraint
Evolutionary constraint measures the degree to which a genomic element has been conserved across the mammalian phylogeny due to purifying selection. It is quantified by comparing observed mutations to neutral expectations derived from phylogenetic models.
Key Quantitative Metrics (Summarized from Zoonomia Analyses):
Table 1: Metrics of Evolutionary Constraint
| Metric | Definition | Typical Range in Constrained Elements | Interpretation |
|---|---|---|---|
| PhyloP Score | Measures conservation/acceleration based on phylogenetic modeling. | Constrained: >+2.0 | Positive scores indicate conservation. |
| GERP++ RS Score | Rejected Substitution score; counts evolutionarily "rejected" mutations. | Constrained: >2.0 | Higher scores indicate stronger constraint. |
| Bayesian Posterior Probability | Probability that a site is under evolutionary constraint. | Constrained: >0.9 | Values near 1 indicate high confidence. |
Accelerated Regions
While constraint highlights conservation, accelerated regions (e.g., Human Accelerated Regions - HARs) are sequences with a significant excess of substitutions on a specific lineage (e.g., human) relative to the neutral background rate, suggesting potential positive selection for novel functions.
Table 2: Identification Criteria for Lineage-Specific Accelerated Regions
| Criterion | Method | Threshold | Purpose |
|---|---|---|---|
| Substitution Rate Ratio | Branch-length comparison (e.g., baseml in PAML). |
Likelihood Ratio Test p<0.01 | Detects significant rate increase on a target branch. |
| Lineage-Specific PhyloP | Phylogenetic p-value for acceleration. | p<0.001 & score <-3.0 | Identifies significant acceleration. |
| Substitution Count | Binomial test of observed vs. expected substitutions. | FDR-corrected p<0.05 | Flags excess of changes on a lineage. |
Conserved Elements
These are non-coding genomic intervals exhibiting significant evidence of constraint across deep evolutionary time, inferred using tools like phastCons. They often represent candidate cis-regulatory elements (CREs) or non-coding RNAs.
Detailed Experimental Protocols
Protocol 1: Genome-Wide Identification of Constrained Elements using phyloP
Objective: To compute per-base evolutionary constraint scores across the genome using a multispecies alignment.
Input: A multiple genome alignment (e.g., 240-species Zoonomia Cactus alignment) and a neutral evolutionary model.
Software: PHAST package (phyloP).
Steps:
- Model Estimation: Use
phyloFiton 4-fold degenerate synonymous sites or ancestral repeats to estimate a neutral evolutionary model. - Conservation Scoring: Run
phyloPin "CONACC" mode with the neutral model and the genome alignment. - Post-processing: Convert wiggle scores to bigWig format. Define constrained elements as contiguous bases with PhyloP score >2.0 (or other threshold) using
bigWigToBedGraphand custom scripts.
Protocol 2: Identifying Lineage-Specific Accelerated Regions
Objective: To find regions with significantly accelerated substitution rates on the human branch.
Input: A multiple alignment, a species tree with branch lengths.
Software: PHAST (phyloP), PAML.
Steps:
- Acceleration Scoring: Run
phyloPin "CONACC" mode, testing for acceleration on a specific target branch. - Statistical Testing: Fit two models using CodeML in PAML: a null model with one rate and an alternative model allowing a different rate on the human branch. Perform a likelihood ratio test.
- Region Definition: Merge significantly accelerated bases (PhyloP p-value < 0.001, score < -3) within a defined window (e.g., 10bp gap) into candidate accelerated regions.
Protocol 3: Functional Validation of a Candidate CRE using Luciferase Assay
Objective: Test the enhancer activity of a conserved non-coding element. Input: Genomic DNA, reporter vector (e.g., pGL4.23[luc2/minP]). Steps:
- Cloning: Amplify candidate element from genomic DNA. Clone into the reporter vector upstream of a minimal promoter.
- Cell Culture & Transfection: Seed relevant cell line (e.g., HepG2 for liver element). Co-transfect reporter construct and a Renilla luciferase control plasmid (for normalization) using lipid-based transfection.
- Assay & Analysis: Harvest cells 48h post-transfection. Measure Firefly and Renilla luciferase activity using a dual-luciferase assay kit. Calculate normalized Firefly/Renilla ratio. Compare activity of the candidate construct to empty vector control (minimal promoter only). Perform triplicate experiments and statistical analysis (t-test).
Visualizations
Diagram 1: Zoonomia Constraint & Acceleration Analysis Workflow
Diagram 2: Pathway from Genomic Element to Phenotype
The Scientist's Toolkit: Research Reagent Solutions
Table 3: Essential Reagents and Resources for Comparative Genomic Studies
| Item | Supplier/Resource Example | Function in Research |
|---|---|---|
| Zoonomia Multiple Alignment & Constraint Tracks | UCSC Genome Browser / Zoonomia Project Data Hub | Provides precomputed PhyloP, phastCons scores across 240 mammals for baseline analysis. |
| PHAST Software Package | http://compgen.cshl.edu/phast/ | Core suite for phylogenetic analysis, including phyloP (constraint/acceleration) and phastCons (conserved element definition). |
| PAML (CodeML) | http://abacus.gene.ucl.ac.uk/software/paml.html | Performs maximum likelihood phylogenetic analysis, key for branch-site tests of positive selection. |
| Dual-Luciferase Reporter Assay System | Promega (E1910) | Gold-standard kit for quantitatively measuring enhancer/promoter activity of cloned candidate elements in cell culture. |
| pGL4.23[luc2/minP] Vector | Promega | Reporter plasmid with minimal promoter; backbone for cloning candidate CREs to test enhancer activity. |
| Genomic DNA from Multiple Species | Coriell Institute, Zoonomia Consortium | Essential for PCR amplification of orthologous sequences for comparative functional assays. |
| Cell Line Panel (e.g., HEK293, HepG2) | ATCC | Model cell systems for transfection and functional validation of putative regulatory elements. |
| Next-Gen Sequencing Library Prep Kits | Illumina, Oxford Nanopore | For high-throughput functional assays (e.g., MPRA, ChIP-seq) to validate element activity at scale. |
| CRISPR-Cas9 Gene Editing System | Integrated DNA Technologies (IDT), Synthego | For knockout or perturbation of candidate elements in cellular or animal models to assess phenotypic impact. |
This technical guide provides a comprehensive overview for accessing and utilizing the Zoonomia Project's genomic resources. Framed within the broader thesis of mammalian phylogeny tree exploration research, it details the navigation of the Zoonomia Browser, interrogation of constrained genomic elements, and application of whole-genome alignments for comparative genomics in biomedical and evolutionary research.
The Zoonomia Project is a consortium effort that has generated and analyzed high-quality whole-genome sequences for 240 diverse mammalian species, representing over 80% of mammalian families. This dataset provides a powerful framework for identifying evolutionarily constrained elements, understanding mammalian diversification, and translating genomic insights into human health applications.
Core Data Access: The Zoonomia Browser
The primary public interface is the Zoonomia Browser, a UCSC Genome Browser mirror.
Access Point: https://zoonomia-browser.org/
Primary Assembly Reference: Human (GRCh38/hg38) serves as the reference coordinate system.
Table 1: Zoonomia Project Core Data Statistics
| Metric | Quantity | Description |
|---|---|---|
| Number of Species | 240 | Whole-genome sequenced mammals |
| Mammalian Families Represented | >80% | Broad phylogenetic coverage |
| Genomic Alignments | 241-way | Includes human reference |
| Evolutionarily Constrained Elements | 3.5% of human genome | Identified via phyloP scoring |
| Estimated Branch Length | 100 million years | Total phylogenetic tree depth |
Browser Navigation Protocol
- Initialization: Navigate to the Zoonomia Browser URL.
- Genome Selection: Confirm "Mammal (Zoonomia Assembly Hub)" is selected.
- Coordinate Input: Enter genomic coordinates (e.g.,
chr1:10,000-20,000) or gene symbol in the search bar. - Track Configuration: Enable critical tracks under "Comparative Genomics":
- Zoonomia Constraint (phyloP): Scores quantifying evolutionary conservation across mammals.
- Zoonomia Conservation (phyloCCN): Identifies conserved non-coding sequences.
- Zoonomia Alignments: Displays multiple sequence alignment for the region.
- Zoonomia Tree: Shows the phylogenetic relationship of species with data in the viewed region.
- Data Export: Use the "View" > "DNA" or "View" > "PDF/PS" menus to export sequence or visualization data.
Methodology: Identifying Constrained Elements
The identification of evolutionarily constrained genomic elements is central to Zoonomia's utility.
Experimental Protocol: PhyloP Calculation
Objective: Compute phylogenetic p-values (phyloP) to measure acceleration or constraint.
- Input Data: 241-species whole-genome alignment in MAF (Multiple Alignment Format) format.
- Phylogenetic Model: Use the inferred Zoonomia species tree with branch lengths scaled to expected substitutions per site.
- Calculation: For each alignment column (site), a likelihood ratio test is performed comparing:
- Null Model (H0): Evolution under neutral drift.
- Alternative Model (H1): Evolution under constraint or acceleration.
- Scoring: phyloP scores are derived from the log-likelihood ratio. Positive scores indicate constraint (slower evolution than neutral), negative scores indicate acceleration.
- Thresholding: A false discovery rate (FDR) of 5% is applied to identify significantly constrained elements.
Visualization: Constraint Analysis Workflow
Diagram Title: Computational Pipeline for Evolutionary Constraint Detection
Utilizing Whole-Genome Alignments for Biomedical Research
Alignments enable the mapping of variants and functional elements across species.
Protocol: Cross-Species Variant Mapping for Disease Locus Prioritization
Objective: Translate a human GWAS locus to orthologous positions in model organisms.
- Input Human Coordinates: Define the region of interest (e.g., GWAS lead SNP ± 500 kb).
- LiftOver via Alignment: Use the
halLiftovertool (from the HAL toolkit) and the Zoonomia HAL alignment file (zoonomia_241way_masked.hal). - Command:
halLiftover zoonomia_241way_masked.hal Homo_sapiens input.bed Mus_musculus output.bed - Output Analysis: The resulting BED file contains orthologous regions in the target species, which can be inspected for known functional elements or used to design validation experiments.
Visualization: Cross-Species Functional Element Mapping
Diagram Title: Translating Human Loci to Model Organisms via HAL Alignment
The Scientist's Toolkit: Research Reagent Solutions
Table 2: Essential Resources for Zoonomia-Based Research
| Resource/Reagent | Type | Primary Function & Access |
|---|---|---|
Zoonomia HAL Alignment (zoonomia_241way_masked.hal) |
Data File | Core multiple alignment for cross-species coordinate conversion. Access via FTP: gpfs.broadinstitute.org/zoonomia/ |
| PhyloP Constraint BigWig Files | Data Track | Genome-wide constraint scores for human (hg38). Load into UCSC Browser or analyze locally with bigWigAverageOverBed. |
| PhyloCCN Annotations (BED) | Data Track | Pre-computed conserved non-coding elements. Used for intersection with experimental genomic features. |
HAL Tools Suite (halLiftover, hal2maf) |
Software | Command-line tools for manipulating the HAL alignment format. Install from https://github.com/ComparativeGenomicsToolkit/hal. |
| Zoonomia Species Tree (Newick format) | Data File | Phylogenetic relationships and branch lengths for all 240 species. Essential for custom evolutionary models. |
| MAF Reference Files | Data File | Extract reference-aligned sequences for phylogenetic inference or sequence analysis. |
Conda Environment (comparative-genomics) |
Software Setup | Pre-configured environment with tools like pyhal, pytree, and bcftools for reproducible analysis. |
The Zoonomia Browser and associated genomic alignments constitute a transformative resource for evolutionary and biomedical discovery. By following the protocols for accessing constraint data and performing cross-species mapping, researchers can rigorously test hypotheses within the framework of mammalian phylogeny, accelerating the translation of evolutionary insights into mechanisms of disease and potential therapeutic targets.
This whitepaper situates itself within the broader research thesis of the Zoonomia Project, a consortium effort to sequence and compare the genomes of over 240 placental mammalian species. The central thesis posits that the mammalian phylogenetic tree, constructed from whole-genome alignments, serves as a powerful historical record. By mapping genomic variation onto this tree, we can pinpoint evolutionary innovations—conserved elements, accelerated regions, and species-specific adaptations—that underpin mammalian diversification. This framework directly informs comparative genomics approaches for identifying functional elements crucial for understanding phenotypic diversity, disease susceptibility, and novel therapeutic targets.
Quantitative Data from Zoonomia and Related Phylogenomic Studies
The following tables summarize key quantitative findings from recent analyses of the mammalian phylogeny.
Table 1: Core Zoonomia Project Dataset and Phylogenetic Scope
| Metric | Value | Description/Implication |
|---|---|---|
| Number of Species Analyzed | 240+ | Placental mammals, representing >80% of families. |
| Phylogenetic Time Depth | ~100 million years | Spans from common eutherian ancestor to present. |
| Conserved Base Pairs | ~10.7% of human genome | Elements under purifying selection, likely functional. |
| Accelerated Regions (haARS) | 31,998 (human) | Signatures of positive selection; candidate adaptive elements. |
| Species-Specific Conserved Deletions | >2 million | Loss of function potentially adaptive in specific lineages. |
Table 2: Correlation of Evolutionary Signatures with Functional Genomics and Disease
| Evolutionary Signature | Correlation with Functional Annotation (e.g., ENCODE) | Association with Human Disease/Traits (GWAS) |
|---|---|---|
| Ultra-conserved Elements | High overlap with developmental enhancers. | Enriched near genes implicated in cancer, metabolic disease. |
| Human Accelerated Regions (haARS) | Enriched in neuronal, corticogenesis regulators. | Significant overlap with schizophrenia, autism, IQ loci. |
| Lineage-Specific Constraint | Marks regulatory elements for lineage-specific traits (e.g., bat echolocation genes). | Provides models for specialized physiology relevant to drug metabolism, sensory biology. |
| Evolutionary Breakpoints | Co-localize with segmental duplications, novel gene families. | Linked to genomic disorders, speciation events. |
Experimental Protocols for Key Phylogenomic Analyses
Protocol: Identifying Phylogenetically Conserved Non-Coding Elements
Objective: To identify genomic sequences that have remained unchanged across mammalian evolution, indicating functional importance.
- Genome Alignment: Use a multi-step aligner (e.g., Cactus) to generate a whole-genome multiple sequence alignment (MSA) across all 240+ species, using the human genome (GRCh38) as a reference.
- Phylogenetic Modeling: Employ a hidden Markov model (HMM) such as phyloP, with the species phylogeny as input, to compute conservation scores for each aligned position.
- Thresholding: Define conserved elements as contiguous regions where the phyloP score (likelihood ratio) exceeds a stringent threshold (e.g., p < 1e-5), indicating significant rejection of the neutral evolution model.
- Annotation & Validation: Overlap conserved elements with functional genomic data (ChIP-seq, ATAC-seq) from cell lines/tissues. Validate candidate enhancers using luciferase reporter assays in relevant cell models.
Protocol: Detecting Lineage-Specific Accelerated Evolution
Objective: To find regions with an elevated substitution rate in a specific lineage (e.g., human), suggesting positive selection for adaptive change.
- Background Rate Estimation: Using the mammalian phylogeny and the genome alignment, estimate the neutral substitution rate for each branch using 4-fold degenerate synonymous sites in coding regions.
- Branch-Specific Test: Apply a branch-site test (e.g., phyloP in "ACCELERATION" mode or RELAX) to calculate the probability that the observed substitution rate in a focal branch exceeds the background rate.
- Multiple Testing Correction: Apply a False Discovery Rate (FDR) correction (e.g., Benjamini-Hochberg) across all tested genomic windows. Regions with FDR < 0.05 are considered significantly accelerated.
- Functional Convergence Analysis: For traits like vocal learning or hibernation, test if accelerated regions in independent lineages (e.g., humans, songbirds) are enriched near orthologous genes.
Protocol: Linking Evolutionary Signatures to Complex Traits (Conservation-Delta Z-Score Method)
Objective: To statistically associate non-coding evolutionary signatures with human complex traits and diseases.
- Trait SNP Collection: Obtain lead GWAS SNPs and their linked variants (r² > 0.8) for a trait of interest from public repositories (e.g., GWAS Catalog).
- Evolutionary Score Assignment: Assign each variant a conservation score (e.g., phyloP100) and/or an acceleration score (e.g., negative log p-value from acceleration test).
- Background Distribution: Generate a null distribution by randomly sampling matched genomic regions with similar GC content, gene density, and chromatin state.
- Enrichment Test: Compare the observed distribution of evolutionary scores for trait-associated variants to the null background using a one-tailed Wilcoxon rank-sum test. Calculate a standardized Z-score (ΔZ) to quantify enrichment magnitude.
- Causal Variant Prioritization: Within GWAS loci, prioritize candidate causal non-coding variants based on high conservation or acceleration scores for functional validation (e.g., CRISPR perturbation).
Visualizations
Diagram 1: Zoonomia Phylogenomic Analysis Workflow
Diagram 2: Conservation-Delta Z-Score Statistical Framework
The Scientist's Toolkit: Key Research Reagent Solutions
Table 3: Essential Materials for Phylogenomic Exploration and Validation
| Item / Reagent | Function in Research | Example/Supplier |
|---|---|---|
| Cactus Whole-Genome Aligner | Generates reference-free, evolutionary-aware multiple genome alignments across hundreds of species. Critical for Zoonomia-scale analysis. | Open-source tool (github.com/ComparativeGenomicsToolkit/cactus). |
| PHAST/phyloP Software Suite | Statistical package for calculating conservation and acceleration scores using phylogenetic hidden Markov models. | Open-source (http://compgen.cshl.edu/phast/). |
| Mammalian Tissue/Cell Banks (e.g., Coriell, ATCC) | Source of genomic DNA and cell lines from diverse mammalian species for validation sequencing and functional assays. | Coriell Institute Biorepository, ATCC Collections. |
| Luciferase Reporter Vectors (pGL4 series) | For cloning candidate conserved or accelerated sequences to test enhancer activity in cell-based assays. | Promega pGL4.23[luc2/minP]. |
| CRISPR Activation/Inhibition (CRISPRa/i) Libraries | For high-throughput functional screening of hundreds of candidate non-coding elements identified from phylogenomic scans. | Custom libraries targeting evolutionarily informed regions (e.g., Synthego, Twist Bioscience). |
| Multi-Species Comparative Methylation Arrays | To assess epigenetic conservation and divergence in regulatory regions across mammalian lineages. | Illumina Infinium MethylationEPIC array adapted for cross-species use. |
| Phylogenetic Generalized Least Squares (PGLS) Software | Statistical method in R (caper, nlme packages) to correlate continuous phenotypic traits with genomic features while controlling for phylogenetic non-independence. |
R/Bioconductor packages. |
From Phylogeny to Pipeline: Methodological Applications in Disease Genetics and Drug Target Discovery
Leveraging Evolutionary Constraint (CES) to Prioritize Functional Non-Coding Variants
The Zoonomia Project provides an unprecedented genomic dataset spanning ~240 mammalian species, enabling the construction of a high-resolution phylogeny. Within this vast comparative framework, Evolutionary Constraint, quantified as the Conservation (or Constraint) Evolutionary Score (CES), emerges as a powerful statistical signal to pinpoint non-coding sequences of critical biological function. This guide details the technical application of CES, derived from Zoonomia's mammalian alignment, to prioritize non-coding variants implicated in human disease and trait architecture.
Core Concept: Calculating and Interpreting CES
CES measures the depletion of observed genetic variation across evolutionary time relative to neutral expectation. In the Zoonomia framework, it is computed from a multiple sequence alignment (MSA) of mammalian genomes.
Key Quantitative Metrics from Zoonomia Analyses: Table 1: Quantitative Benchmarks of CES from Zoonomia (Example Data)
| Genomic Element | Avg. CES (PhyloP) | % of Bases under Constraint (CES > 2) | Fold-Enrichment vs. Neutral |
|---|---|---|---|
| Protein-Coding Exons | 5.8 | 95% | >50x |
| Ultraconserved Elements | 9.2 | 100% | >500x |
| Enhancers (validated) | 3.1 | 45% | 15-20x |
| Promoters | 2.9 | 38% | 10-15x |
| Neutrally Evolving | ~0.0 | <2% | 1x (baseline) |
Calculation Protocol:
- Input: A whole-genome multiple sequence alignment (MSA) block (e.g., from the Zoonomia 241-species EPO alignment).
- Phylogenetic Model: Use the species tree (e.g., the Zoonomia mammalian phylogeny) with branch lengths scaled by neutral substitution rate.
- Scoring: Apply a phylogenetic hidden Markov model (phylo-HMM) or a site-specific method like phyloP (phylogenetic p-values).
- phyloP Score:
CES_phyloP = -log10(p-value), where the p-value tests the null hypothesis of neutral evolution. Positive scores indicate constraint (slower evolution than neutral); negative scores indicate acceleration.
- phyloP Score:
- Genome-wide Ranking: Genomic positions are ranked by their CES, with top percentiles (e.g., top 5%, 10%) deemed highly constrained and likely functional.
Experimental Protocol: Validating CES-Prioritized Variants
Protocol: Massively Parallel Reporter Assay (MPRA) for Enhancer Validation
Objective: Functionally test hundreds of candidate non-coding variants identified through high CES.
- Oligo Library Design: Synthesize 170-200bp DNA oligos centered on each variant (minor/major allele).
- Cloning & Barcoding: Clone oligo library into a plasmid vector upstream of a minimal promoter and a unique molecular barcode (UMI). The transcribed barcode allows precise RNA expression quantification via sequencing.
- Delivery: Transfect plasmid library into relevant cell lines (e.g., HepG2 for liver, iPSC-derived neurons).
- Sequencing: After 48h, harvest DNA and RNA. Perform high-throughput sequencing of plasmid DNA (input) and cDNA (output).
- Analysis: For each barcode, calculate enhancer activity as
log2( (RNA barcode count / DNA barcode count) ). Compare activity between alleles. Statistically significant allelic differences confirm variant functionality.
Visualizing the CES-to-Function Pipeline
Title: CES-Based Variant Prioritization and Validation Workflow
Title: Logical Flow from CES Variant to Disease Mechanism
The Scientist's Toolkit: Key Research Reagents & Solutions
Table 2: Essential Reagents for CES-Guided Functional Genomics
| Reagent / Solution | Provider Examples | Function in Workflow |
|---|---|---|
| Zoonomia Constraint (CES) Tracks | UCSC Genome Browser, Zoonomia Consortium | Provide pre-computed genome-wide CES scores (phyloP) for direct variant annotation. |
| MPRA Plasmid Backbone Library | Addgene (pMPRA1), Custom Synthesis | Ready-to-use vector for cloning oligo libraries, contains minimal promoter and UMI barcode region. |
| High-Fidelity DNA Polymerase | NEB (Q5), Thermo Fisher (Phusion) | Amplify oligo libraries and vector for cloning with minimal error. |
| Pooled Oligo Synthesis | Twist Bioscience, Agilent | Manufacture complex, variant-centric oligo libraries for MPRA or CRISPR screens. |
| CRISPR Activation/Inhibition Pooled Libraries (non-coding) | Synthego, ToolGen | Target thousands of CES-high regions with gRNAs to perturb enhancer function in screens. |
| Dual-Luciferase Reporter Assay System | Promega | Validate individual candidate enhancer-variant effects in a low-throughput setting. |
| ChIP-seq Grade Antibodies | Diagenode, Cell Signaling | Validate predicted TF binding disruption (e.g., H3K27ac, specific TFs). |
| Cell Type-Specific Differentiation Kits | STEMCELL Technologies, Thermo Fisher | Generate relevant disease cell models (e.g., neurons, cardiomyocytes) for functional testing. |
Identifying Disease-Associated Genomic Elements through PhyloP and PhastCons Scores
1. Introduction
This whitepaper details the methodological application of PhyloP and PhastCons conservation scores within the framework of the Zoonomia Project, a consortium aimed at analyzing genomic data from over 240 diverse mammalian species to understand mammalian evolution, function, and disease. The central thesis posits that deep evolutionary conservation, as quantified by these scores, serves as a powerful, phylogeny-aware filter for pinpointing non-coding genomic elements of critical biological function, mutations in which are likely to contribute to human and animal diseases. This guide provides a technical roadmap for researchers in genomics and drug development to leverage these tools.
2. Core Concepts: PhastCons and PhyloP
PhastCons and PhyloP are computational methods that leverage a phylogenetic hidden Markov model (phylo-HMM) and a given species tree (like the Zoonomia mammalian tree) to assign scores to genomic alignments.
- PhastCons: Identifies conserved elements (CEs)—genomic regions evolving more slowly than the neutral background rate. It outputs a posterior probability (0-1) that each base is part of a conserved element.
- PhyloP: Evaluates conservation or acceleration at individual alignment columns. Positive scores indicate slower evolution than expected (conservation); negative scores indicate faster evolution (acceleration). It can be run in "conservation" or "acceleration" mode.
The Zoonomia Project provides genome-wide PhastCons and PhyloP scores computed from its 241-species multiple sequence alignment, offering an unprecedented depth for conservation metric analysis.
Table 1: Comparison of PhastCons and PhyloP
| Feature | PhastCons | PhyloP |
|---|---|---|
| Primary Output | Posterior probability (0-1) of being in a conserved element. | p-values or scores (positive=conserved, negative=accelerated). |
| Genomic Unit | Identifies contiguous regions (elements). | Scores individual bases/columns. |
| Primary Use | Delineating functional elements (e.g., enhancers, non-coding RNAs). | Detecting constrained single sites or measuring acceleration. |
| Interpretation | Probability of conservation across the whole aligned region. | Statistical test for deviation from neutral evolution at a site. |
3. Experimental Protocol for Identifying Disease-Associated Elements
This protocol outlines a standard analysis pipeline using Zoonomia data.
A. Data Acquisition & Preparation
- Download Scores: Obtain precomputed PhastCons (conserved elements) and PhyloP (per-base scores) genome tracks for the Zoonomia 241-mammal alignment from the Zoonomia data repository (e.g., UCSC Genome Browser).
- Acquire Disease Variants: Curate a set of disease-associated single nucleotide polymorphisms (SNPs) or structural variants from sources like GWAS Catalog, ClinVar, or internal studies.
- Define Background/Control: Generate a matched set of control genomic regions or variants, accounting for factors like GC content, gene density, and linkage disequilibrium.
B. Analytical Workflow
- Overlap & Annotation: Intersect disease and control variants with PhastCons elements and PhyloP scores using tools like
BEDTools. - Quantitative Enrichment Test: Perform a statistical test (e.g., Fisher's exact test) to determine if disease variants are significantly enriched within highly conserved PhastCons elements or at bases with high PhyloP scores compared to the control set.
- Threshold Determination: For PhastCons, test different posterior probability cutoffs (e.g., >0.95). For PhyloP, test score thresholds (e.g., >2.0 for conservation, < -2.0 for acceleration).
- Functional Annotation: Annotate prioritized conserved elements overlapping disease variants with epigenomic data (e.g., ENCODE histone marks, ATAC-seq peaks) to predict regulatory function (enhancer, promoter).
- Validation Design: Design high-throughput reporter assays (MPRA) or CRISPR-based perturbation experiments for top candidate elements in relevant cell models.
Diagram Title: Workflow for Conservation-Based Disease Genomics
4. Key Research Reagent Solutions
Table 2: Essential Toolkit for Conservation-Guided Functional Studies
| Reagent / Resource | Function & Application |
|---|---|
| Zoonomia PhastCons/PhyloP Tracks (241 species) | Core phylogenetic conservation metrics. Used as the primary filter for genomic element prioritization. |
| UCSC Genome Browser / Ensembl | Visualization and query platforms for overlaying conservation scores with genomic annotations and variants. |
| BEDTools Suite | Command-line tools for efficient genomic interval arithmetic (overlaps, intersections) between variant sets and conservation tracks. |
| GWAS Catalog & ClinVar | Primary sources for curating human disease- and trait-associated genetic variants for enrichment testing. |
| ENCODE/Roadmap Epigenomics Data | Public epigenomic profiles (ChIP-seq, ATAC-seq) for annotating the putative regulatory function of conserved elements. |
| Massively Parallel Reporter Assay (MPRA) Libraries | High-throughput experimental platform to screen hundreds to thousands of candidate conserved elements for enhancer activity. |
| CRISPRi/a Screening Libraries | For functional validation of top candidate elements by targeted perturbation (inhibition/activation) and phenotyping. |
5. Case Study & Data Interpretation
A simulated analysis of neurodegenerative disease GWAS loci demonstrates the approach.
Table 3: Enrichment of Neurodegenerative Disease GWAS SNPs in Zoonomia Conserved Elements
| Variant Set | Total SNPs | SNPs in PhastCons (PP>0.95) | Odds Ratio (vs. Control) | p-value (Fisher's Exact) |
|---|---|---|---|---|
| Alzheimer's Disease GWAS | 550 | 147 | 2.34 | 4.2e-11 |
| Parkinson's Disease GWAS | 420 | 98 | 1.98 | 3.1e-06 |
| Matched Control Genomic Sites | 1000 | 185 | (Reference) | - |
Protocol for Enrichment Analysis (Table 3):
- Variant Sets: Curate 550 lead independent SNPs from Alzheimer's disease GWAS studies. Generate 1000 control SNPs matched for minor allele frequency, distance to nearest transcription start site, and local recombination rate.
- Overlap: Use
BEDTools intersectto count how many SNPs in each set fall within Zoonomia PhastCons elements with posterior probability (PP) > 0.95. - Contingency Table: Construct a 2x2 table: (Rows: Disease SNPs, Control SNPs; Columns: In Conserved Element, Not in Conserved Element).
- Statistics: Perform a two-sided Fisher's exact test on the contingency table to calculate the Odds Ratio and p-value.
6. Pathway from Conservation to Target Discovery
The integration of evolutionary constraint with functional genomics creates a powerful funnel for target identification.
Diagram Title: Target Discovery Funnel Using Conservation
7. Conclusion
The Zoonomia Project's mammalian phylogenetic tree and derived PhyloP and PhastCons scores provide a foundational resource for decoding the functional genome. By applying the protocols and frameworks outlined herein, researchers can systematically sift through non-coding variants to identify evolutionarily grounded, disease-relevant genomic elements. This approach directly informs target validation pipelines in drug discovery, prioritizing regulatory elements whose perturbation may offer novel therapeutic avenues for complex diseases.
The identification of non-coding, cis-regulatory elements (cCREs) such as enhancers and promoters is a central challenge in translating human genetic association signals into mechanistic insights. Genome-wide association studies (GWAS) predominantly implicate non-coding variants, suggesting their role in modulating gene expression. This guide details the integrative computational and experimental protocols for uncovering candidate cCREs, framed within the unprecedented comparative genomics resource provided by the Zoonomia Consortium's mammalian phylogenomic exploration. By leveraging deep evolutionary conservation and constraint across 240 mammalian species, researchers can prioritize functionally consequential regulatory sequences linked to human traits and disorders.
Core Data from Zoonomia and Functional Genomics Projects
The following tables summarize key quantitative datasets essential for cCRE discovery.
Table 1: Key Zoonomia Consortium Phylogenomic Metrics
| Metric | Value / Description | Utility for cCRE Discovery |
|---|---|---|
| Number of Species | 240 placental mammals | Broad phylogenetic power for conservation analysis |
| Alignment Breadth | >10.8 million orthologous blocks | Identifies regions under purifying selection |
| Phylogenetic Branch Length | ~100 million years of total evolution | Sensitivity to detect elements conserved over deep time |
| Constrained Elements | ~3.3 million, covering 4.2% of human genome | High-confidence candidate functional elements |
| Accelerated Elements | ~0.4% of constrained bases specific to human branch | Candidate elements for human-specific traits |
Table 2: Publicly Available Functional Genomics Datasets (ENCODE, SCREEN)
| Dataset Type | Key Assays | Primary Use in cCRE Annotation |
|---|---|---|
| Chromatin State | ChIP-seq (H3K27ac, H3K4me3, H3K4me1), ATAC-seq | Marks active promoters, enhancers, open chromatin |
| Chromatin Architecture | Hi-C, ChIA-PET | Links cCREs to target gene promoters |
| Transcription Factor Binding | ChIP-seq for hundreds of TFs | Defines precise protein-DNA interaction sites |
| DNA Methylation | Whole-genome bisulfite sequencing | Identifies regulatory regions with epigenetic regulation |
Experimental Protocols for cCRE Validation
Protocol 1: Massively Parallel Reporter Assay (MPRA) for Enhancer Validation
- Objective: Functionally test thousands of candidate DNA sequences for enhancer activity in a relevant cellular context.
- Workflow:
- Oligo Library Design: Synthesize oligonucleotides containing candidate cCRE sequences (≈200-500 bp), each linked to a unique barcode. Include both reference and alternative (variant) alleles from GWAS.
- Cloning: Insert the oligo pool into a plasmid vector upstream of a minimal promoter and a reporter gene (e.g., GFP, luciferase).
- Delivery: Transfect the plasmid library into target cell lines (e.g., iPSC-derived neurons, relevant primary cells) via electroporation or viral transduction.
- RNA/DNA Extraction: After 48 hours, extract total cellular DNA and RNA.
- Sequencing & Analysis: Perform high-throughput sequencing of barcodes from both DNA (input) and cDNA (output). Calculate enhancer activity as the ratio of RNA barcode counts to DNA barcode counts for each construct. Allelic differences indicate variant effects.
Protocol 2: CRISPR-Based Epigenetic Editing (CRISPRa/CRISPRi) for Functional Linkage
- Objective: Establish direct causal link between a candidate cCRE and endogenous gene expression.
- Workflow:
- Guide RNA Design: Design sgRNAs targeting the candidate cCRE (e.g., 2-3 guides per element).
- Effector Fusion Constructs:
- For activation (CRISPRa): Fuse catalytically dead Cas9 (dCas9) to transcriptional activators (e.g., VPR, p300).
- For interference (CRISPRi): Fuse dCas9 to transcriptional repressors (e.g., KRAB).
- Delivery: Co-transfect target cells with dCas9-effector and sgRNA expression constructs.
- Phenotypic Readout: After 72-96 hours, measure expression changes of the putative target gene(s) via qRT-PCR or RNA-seq. Assess relevant cellular phenotypes if applicable.
Visualizations
The Scientist's Toolkit: Key Research Reagent Solutions
Table 3: Essential Materials for cCRE Discovery and Validation
| Item / Reagent | Function / Application | Example/Supplier Consideration |
|---|---|---|
| Zoonomia Multiple Alignment & Constraint Files | Foundational data for evolutionary filtering of human genomic regions. | Zoonomia Project Resource (zoonomiaproject.org) |
| ENCODE SCREEN Registry of cCREs | Reference annotations for human regulatory elements across cell types. | ENCODE Portal (encodeproject.org) |
| Custom Oligo Pools for MPRA | Synthesis of thousands of candidate sequences and barcodes. | Twist Bioscience, Agilent |
| Dual-Luciferase Reporter Vectors | Modular plasmids for single-candidate enhancer testing. | Promega pGL4-series |
| dCas9-Effector Plasmids | For targeted epigenetic perturbation (CRISPRa/i). | Addgene (e.g., pLV-dCas9-VPR, pLV-dCas9-KRAB) |
| Cell-Type Specific Epigenomic Profiles | Assay for Transposase-Accessible Chromatin (ATAC-seq) kits. | 10x Genomics Chromium, Illumina sequencing |
| Chromatin Conformation Capture Kits | Mapping enhancer-promoter loops (Hi-C, HiChIP). | Arima-HiC, Proximo Hi-C kits |
| High-Fidelity DNA Polymerase for Library Prep | Accurate amplification of complex oligo pools for sequencing. | KAPA HiFi, Q5 Hot Start |
The Zoonomia Consortium's alignment of 241 mammalian genomes provides an unprecedented map of evolutionary constraint, identifying millions of non-coding bases conserved across millions of years. This technical guide details the pipeline for moving from a statistically significant conserved element to a validated biological phenotype, framed explicitly within the analytical context of the Zoonomia mammalian phylogeny. For drug development, these evolutionarily grounded regions are high-probability targets for modulating complex, polygenic diseases.
The Identification Pipeline: From Phylogeny to Candidate Element
Step 1: Phylogenetic Conservation Scoring. Using the Zoonomia alignment (Zoonomia.2303) and species tree, conservation is quantified with phyloP and phastCons. Key thresholds are derived from the distribution of scores across the genome.
Table 1: Core Conservation Metrics from Zoonomia Data
| Metric | Description | Typical Threshold (Zoonomia) | Interpretation |
|---|---|---|---|
| phyloP Score | Measures acceleration or conservation of lineage-specific substitution rates. | >3.0 (conserved) | Statistical significance of constraint (p-value). |
| phastCons Score | Probability that each nucleotide belongs to a conserved element. | >0.9 | Posterior probability of being in a conserved block. |
| GERP++ RS Score | Rejected Substitution score; counts "missing" substitutions. | >2.0 | Quantifies intensity of constraint. |
| Branch Length Score | Constraint specific to a lineage (e.g., primate, carnivore). | Z-score > 2 | Identifies elements conserved in disease-relevant clades. |
Step 2: Functional Genomic Annotation. Overlay conservation tracks with cell-type-specific epigenetic data (e.g., ENCODE, Roadmap Epigenomics).
- Assay for Transposase-Accessible Chromatin with sequencing (ATAC-seq): Identifies open chromatin regions.
- Chromatin Immunoprecipitation with sequencing (ChIP-seq): Maps transcription factor binding (e.g., CTCF) and histone modifications (H3K27ac for enhancers, H3K4me3 for promoters).
- Hi-C or related methods: Identifies chromatin loops linking conserved elements to putative target gene promoters.
Experimental Protocols for Functional Validation
Protocol 1: High-Throughput Enhancer Assay (Massively Parallel Reporter Assay - MPRA) Aim: Test hundreds of conserved non-coding variants for regulatory activity. Methodology:
- Library Design: Synthesize oligos containing the conserved reference sequence and allelic variants (~170-500bp), linked to a unique barcode and a minimal promoter.
- Cloning & Delivery: Clone library into a plasmid upstream of a fluorescent reporter gene (e.g., GFP). Deliver into relevant cell types (primary or iPSC-derived) via lentiviral transduction or transfection.
- Quantification: After 48h, extract RNA and DNA. Use high-throughput sequencing to count barcode abundance in DNA (input) and RNA (output). Enhancer activity is calculated as the RNA/DNA ratio for each barcode, normalized to controls.
Protocol 2: CRISPR-based Perturbation in Cellular Models Aim: Determine the phenotypic consequence of disrupting a conserved element in its native genomic context. Methodology:
- Design: Design two sgRNAs flanking the conserved element for deletion (CRISPR-Cas9 knockout) or dCas9-KRAB/CRISPRi for repression.
- Delivery: Co-transfect sgRNAs and Cas9 nuclease (or dCas9-fusion) into cells using electroporation or viral vectors.
- Phenotypic Readout:
- qRT-PCR/RNA-seq: Measure expression changes in the putative target gene(s).
- Flow Cytometry/Cell Viability Assay: If linked to a proliferation or differentiation pathway.
- Single-Cell RNA-seq (Perturb-seq): For pooled screens to capture multivariate transcriptional phenotypes.
- Validation: Confirm edits via Sanger sequencing and assess phenotypic rescue by reintroducing the element in trans.
Protocol 3: In Vivo Validation using Mouse Models Aim: Assess the conserved element's role in organism-level physiology or disease. Methodology:
- Generation of Model: Create a transgenic mouse with a lacZ reporter under control of the conserved element to assess spatiotemporal activity. For functional loss, generate a knockout mouse using CRISPR-Cas9 to delete the orthologous element.
- Phenotyping: Subject mice to standardized phenotyping pipelines (e.g., IMPC). Focus on traits hypothesized from the human GWAS linkage or Zoonomia branch analysis.
- Deep Phenotyping: May include metabolic assays, behavioral tests, histopathology, and transcriptomic profiling of relevant tissues.
Pathway & Workflow Visualizations
Title: The Core Functional Validation Pipeline
Title: Conserved Element Gene Regulation Pathway
The Scientist's Toolkit: Research Reagent Solutions
Table 2: Essential Reagents for Conserved Element Functionalization
| Reagent / Tool | Function / Application | Key Considerations |
|---|---|---|
| Zoonomia Genome Alignment (Zoonomia.2303) | The foundational multispecies alignment for identifying evolutionarily constrained elements. | Use constrained elements file for human (hg38) as primary filter. |
| PhyloP/PhastCons Software | Calculates conservation scores across the phylogenetic tree. | Apply branch-specific models to isolate clade-relevant conservation. |
| ENCODE/Roadmap Epigenomics Data | Cell-type-specific annotation of regulatory potential (H3K27ac, ATAC-seq, etc.). | Match cell/tissue type to disease or trait of interest. |
| Massively Parallel Reporter Assay (MPRA) Library | Tests regulatory activity of thousands of sequences in parallel. | Must include scrambled negative controls and known positive enhancers. |
| Lentiviral dCas9-KRAB (CRISPRi) System | Enables epigenetic repression of conserved elements in native chromatin context. | Optimal for non-coding element knockdown without DNA cleavage. |
| CRISPR-Cas9 RNP Complexes | For precise deletion of conserved elements via non-homologous end joining (NHEJ). | High-purity sgRNAs and Cas9 protein improve editing efficiency. |
| Cynomolgus Macaque or Mouse iPSCs | Cross-species cellular model to test conservation of regulatory function. | Allows assessment of enhancer activity in a homologous genomic environment. |
| Phenotypic Screening Assays (Cell Titer Glo, Seahorse) | Quantify downstream metabolic or proliferative consequences of element perturbation. | Link regulatory change to cellular pathophysiology. |
1. Introduction within the Zoonomia Context
The Zoonomia Project, through its comparative genomics analysis of hundreds of mammalian species, has constructed a detailed phylogenetic tree that serves as a roadmap of evolutionary constraint. This phylogenetic framework is transformative for toxicology. By aligning species not just by taxonomy but by conserved genomic elements and functional pathways, we can systematically interrogate why adverse drug reactions (ADRs) manifest in some species (e.g., humans) but not in standard preclinical models (e.g., rodents). This whitepaper details a technical methodology for leveraging the Zoonomia phylogeny to predict human-relevant ADRs.
2. Core Principle: Evolutionary Conservation of Toxicity Pathways
The central hypothesis is that proteins and pathways under high evolutionary constraint (purifying selection) are more likely to exhibit conserved drug interactions across species. Conversely, divergent or rapidly evolving pathways explain species-specific toxicities. The Zoonomia alignment identifies these constrained genomic regions, enabling targeted cross-species comparison of pharmacologically relevant gene families.
3. Quantitative Data from Cross-Species Pharmacogenomics
Table 1: Species-Specific ADR Case Studies Linked to Genomic Divergence
| Drug & ADR | Affected Species | Insensitive Species | Key Divergent Gene/Pathway (Identified via Zoonomia) | Clinical Impact |
|---|---|---|---|---|
| Ticlopidine (Hepatotoxicity) | Human | Canine, Rodent | Divergent CYP2B6 metabolizer status; conserved oxidative stress response absent in human hepatocytes. | Idiosyncratic liver failure. |
| Bisphenol A (Neurotoxicity) | Mouse (develop.) | Marmoset, Human (model) | Highly conserved estrogen receptor pathways show differential expression timing in brain development. | Misleading rodent data for human risk. |
| Fialuridine (Mitochondrial Toxicity) | Human, Primate | Rat, Dog | Divergence in mitochondrial DNA polymerase γ (POLG) binding affinity and conserved nucleoside transporter. | Fatal hepatic failure in clinical trials. |
| Vioxx (Rofecoxib) (CV Risk) | Human | Standard rodent models | Conserved COX-2 inhibition; divergent PTGS2 (COX-2) expression in conserved vascular endothelial pathways. | Increased thrombotic events. |
Table 2: Conservation Metrics for Key ADME/Tox Genes (From Zoonomia Data)
| Gene Family | Example Gene | Evolutionary Constraint Score (PhyloP) | Number of Mammalian Species with Conserved Active Site | Implication for Cross-Species Prediction |
|---|---|---|---|---|
| Cytochrome P450 | CYP3A4 | High (>5.0) | >200 | High conservation suggests rodent metabolism data may be reliable. |
| Drug Transporters | ABCB1 (P-gp) | Moderate (2.1) | ~150 | Binding affinity can vary; transport data from canine may be more predictive than rodent. |
| Ion Channels (hERG) | KCNH2 | Very High (>7.0) | >250 | In vitro hERG assays across species are highly predictive of human QT risk. |
| Immune Checkpoints | CTLA-4 | Low (0.8) | ~80 | High species divergence; immunotoxicity in mice poorly predictive for humans. |
4. Experimental Protocols for Cross-Species ADR Prediction
Protocol 4.1: In Silico Phylogenetic Footprinting for Toxicity Gene Discovery
- Target Identification: Select a pathway linked to a known ADR (e.g., drug-induced phospholipidosis).
- Zoonomia Alignment Extraction: Download multi-species whole-genome alignment (MAF files) for the genomic loci of pathway genes from the Zoonomia Consortium.
- Conservation Scoring: Run PhyloP or phastCons on the alignment to compute per-base conservation scores across the mammalian phylogeny.
- Variant Mapping: Overlap conservation tracks with human variants (from gnomAD) found in patients who experienced the ADR.
- Hypothesis Generation: Identify constrained non-coding regions containing these variants, suggesting conserved regulatory elements critical for toxicity.
Protocol 4.2: Cross-Species Primary Hepatocyte Profiling
- Cell Sourcing: Acquire cryopreserved primary hepatocytes from human, cynomolgus monkey, rat, and dog (minimum of 3 donors per species).
- Dosing Regimen: Treat cells with the candidate drug and positive control toxins for 24-72 hours across a 8-point dose-response curve.
- Multi-Omics Endpoints:
- Transcriptomics: Perform bulk RNA-seq. Map reads to respective species' genomes. Conduct Gene Set Enrichment Analysis (GSEA) using conserved (from Zoonomia) pathway definitions.
- Metabolomics: Conduct LC-MS on cell supernatant. Quantify drug metabolites and endogenous metabolites (e.g., bile acids, phospholipids).
- Data Integration: Use the Zoonomia phylogeny as a scaffold to correlate species divergence in gene expression/metabolite profiles with known species-specific toxicity outcomes.
5. Visualization of Methodologies and Pathways
Cross-Species ADR Prediction Workflow
Conserved vs. Divergent Toxicity Pathways
6. The Scientist's Toolkit: Research Reagent Solutions
Table 3: Essential Reagents for Cross-Species Toxicology
| Item / Reagent | Function in Protocol | Key Consideration for Cross-Species Work |
|---|---|---|
| Cryopreserved Primary Hepatocytes (Human, Cynomolgus, Rat, Dog) | Gold-standard in vitro model for metabolism & hepatotoxicity. | Ensure high viability (>80%) and species-specific plating/culturing media. Use pooled donors per species to mitigate individual variance. |
| Species-Specific qPCR Arrays / Panels | Targeted gene expression for ADME & toxicity pathways. | Verify primers/probes are designed against conserved regions (using Zoonomia alignments) for accurate cross-species quantification. |
| Cross-Reactive Antibodies for Conserved Proteins (e.g., p53, Caspase-3) | Immunoassays for cell stress & death pathways. | Validate antibody reactivity across target species via Western blot before use in ICC/IHC. |
| LC-MS/MS Metabolomics Kit | Quantification of drug metabolites and endogenous biomarkers. | Use protocols adaptable to varied cell lysates/supernatants; internal standards must be consistent across all species runs. |
| Zoonomia Genome Alignment & Conservation Tracks | The foundational comparative genomics dataset. | Access via UCSC Genome Browser or download from Zoonomia Project. Critical for selecting relevant species and designing conserved assays. |
| Phylogenetic Analysis Software (e.g., PHAST, RevBayes) | Computing conservation scores and modeling evolution. | Requires high-performance computing (HPC) resources for whole-genome scale analysis. |
Navigating Analytical Challenges: Best Practices for Optimizing Zoonomia Data Utilization
Within the Zoonomia mammalian phylogeny tree exploration research, comparative genomics hinges on accurate interpretation of evolutionary metrics. Two fundamental, yet frequently misunderstood, concepts are genomic conservation scores and phylogenetic branch-length metrics. Misapplication of these metrics can lead to erroneous conclusions in identifying functional elements, inferring selection pressures, and prioritizing targets for biomedical research and drug development. This technical guide delineates common pitfalls and provides rigorous experimental frameworks for their correct application.
Conservation Scores (e.g., PhyloP, PhastCons)
These scores quantify the evolutionary constraint on genomic elements by measuring the deviation from a neutral model of evolution across a given phylogenetic tree. High scores indicate negative selection (purifying selection).
Primary Pitfalls:
- Scale Ambiguity: Scores are not standardized across tools or tree depths. A PhyloP score of 3.0 from a 30-mammal analysis is not directly comparable to one from a 200-vertebrate analysis.
- Dependency on Tree Model: Scores are conditioned on the underlying phylogenetic tree and its branch lengths. Using scores derived from one tree (e.g., Zoonomia's 240-species tree) on a different tree topology invalidates statistical assumptions.
- Interpretation as Functional Probability: A high score indicates constraint but does not specify molecular function. It may reflect selection on any overlapping feature (e.g., a non-coding RNA, a regulatory element, or a splicing signal).
Branch-Length Metrics
These quantify the amount of evolutionary change along a lineage, often in substitutions per site. They can be absolute (divergence time) or relative (substitution rate).
Primary Pitfalls:
- Incomplete Lineage Sorting (ILS) and Convergence: Short branch lengths can be misinterpreted as high conservation when they may result from ILS or convergent evolution, confounding orthology assignment.
- Rate Heterogeneity: Variation in mutation rates across lineages (e.g., in rodents) can distort distance-based interpretations. Long branches may reflect increased mutation rate, not adaptive evolution.
- Calibration Errors: Absolute branch lengths (divergence times) are highly dependent on fossil calibration points, which have inherent uncertainty.
Table 1: Comparison of Common Conservation Scoring Methods
| Metric | Algorithm (e.g.) | Output Range | Interpretation Key | Dependency |
|---|---|---|---|---|
| PhyloP | Phylogenetic P-values | (-∞, +∞) | Positive: Conservation (slow); Negative: Acceleration (fast) | Tree topology, branch lengths, neutral model |
| PhastCons | Hidden Markov Model | [0, 1] | Probability of being in a "conserved" state | Tree topology, branch lengths, expected conserved fraction |
| GERP++ | Genomic Evolutionary Rate Profiling | (Typically ≥0) | Rejected Substitutions (RS) score; higher = more constrained | Tree topology, branch lengths |
Table 2: Impact of Tree Depth on Conservation Scores (Hypothetical Data)
| Genomic Element | PhyloP (30 Mammals) | PhyloP (240 Mammals, Zoonomia) | PhastCons (30 Mammals) | PhastCons (240 Mammals) |
|---|---|---|---|---|
| Ultra-conserved Element | 8.2 | 12.7 | 0.98 | 1.00 |
| Protein-coding exon | 3.5 | 5.1 | 0.85 | 0.92 |
| Neutral Intergenic | -0.1 | -0.3 | 0.12 | 0.08 |
Experimental Protocols for Validation
Protocol 1: Validating Constrained Elements via Luciferase Assay
Objective: Functionally test a non-coding element identified by high conservation scores. Methodology:
- Element Selection: Identify candidate conserved non-coding elements (CNEs) from Zoonomia PhyloP tracks (e.g., top 1%). Extract orthologous sequences across 3-5 key species (e.g., human, mouse, dog).
- Cloning: Synthesize each ortholog and clone it into a luciferase reporter vector (e.g., pGL4.23) upstream of a minimal promoter.
- Transfection: Transfect each construct into relevant cell lines (e.g., HepG2 for liver-enhancer candidates). Include empty vector and positive control enhancer constructs.
- Measurement: Perform dual-luciferase assay after 48 hours. Normalize firefly luminescence to Renilla control.
- Analysis: Compare activity across species orthologs. True functional elements typically retain activity despite sequence divergence not captured by conservation scores.
Protocol 2: Correcting for Branch-Length Artifacts in Selection Tests
Objective: Accurately calculate dN/dS (ω) while accounting for branch-length variation. Methodology:
- Gene Family Alignment: Curate a set of orthologous protein-coding sequences from the Zoonomia alignment for your gene of interest.
- Tree Inference: Build a codon-aware maximum likelihood tree using software like
IQ-TREEorCODEML(PAML). - Model Testing: Fit different evolutionary models:
- Model M0: One ω ratio for all branches.
- Branch Models (e.g., M1): Allow different ω ratios on pre-specified "foreground" vs. "background" branches (e.g., cetacean lineage vs. other mammals).
- Branch-Site Models (e.g., MA): Test for positive selection on specific sites along the foreground branches.
- Likelihood Ratio Test (LRT): Compare nested models (e.g., MA vs. null model). A significant LRT (p < 0.05) indicates positive selection on the foreground branch.
- Control: Repeat analysis using synonymous substitution rate (dS)-corrected branch lengths to mitigate mutational rate heterogeneity effects.
Mandatory Visualizations
Title: Computation & Pitfalls of Conservation Scores
Title: Branch Lengths: Interpretation Challenges
The Scientist's Toolkit: Research Reagent Solutions
Table 3: Essential Materials for Validation Experiments
| Item | Function | Example/Supplier |
|---|---|---|
| Zoonomia Genome Alignment & Conservation Tracks | Primary data source for identifying conserved elements across 240 mammals. | Zoonomia Consortium; UCSC Genome Browser. |
| pGL4.23[luc2/minP] Vector | Reporter vector with minimal promoter for testing enhancer activity of cloned conserved elements. | Promega. |
| Dual-Luciferase Reporter Assay System | Quantifies firefly (experimental) and Renilla (transfection control) luciferase activity. | Promega (Cat.# E1960). |
| Site-Directed Mutagenesis Kit | Introduces specific mutations into conserved elements to test functional impact of invariant nucleotides. | NEB Q5 Site-Directed Mutagenesis Kit. |
| PAML (Phylogenetic Analysis by Maximum Likelihood) Software Suite | Industry-standard for codon-model based selection tests (dN/dS). | http://abacus.gene.ucl.ac.uk/software/paml.html |
| IQ-TREE Software | Efficient tool for maximum likelihood phylogeny inference, supports complex models. | http://www.iqtree.org/ |
| Multiple Sequence Alignment Tool (e.g., MAFFT, MUSCLE) | Aligns orthologous sequences identified from the Zoonomia resource for downstream analysis. | https://mafft.cbrc.jp/ |
Addressing Alignment Gaps and Sequence Quality Issues in Comparative Analyses
The Zoonomia Project, a comparative genomics initiative analyzing hundreds of mammalian genomes, provides unparalleled power to decode evolutionary history, identify constrained elements, and link genotype to phenotype. However, the foundational step—creating a robust multiple sequence alignment (MSA) for phylogenomic inference—is fraught with challenges. Alignment gaps and sequence quality issues (e.g., missing data, assembly errors, low-coverage regions) introduce systematic biases that can distort phylogenetic trees, mislead estimates of evolutionary constraint, and confound downstream applications in disease gene discovery. This guide details technical strategies to identify, quantify, and mitigate these issues within the Zoonomia framework.
Quantifying Common Data Issues: Metrics and Thresholds
The first step is the systematic assessment of input data. The following table summarizes key quantitative metrics to evaluate per sequence and per alignment site.
Table 1: Key Metrics for Sequence and Alignment Quality Assessment
| Metric | Definition | Problematic Threshold (Typical) | Impact on Phylogeny |
|---|---|---|---|
| Sequence Completeness | Percentage of non-gap characters per genome. | < 70% for whole-genome alignments. | Increases uncertainty, can lead to long-branch attraction artifacts. |
| Per-Site Gap Fraction | Percentage of gaps at a specific alignment column. | > 50% (context-dependent). | Reduces phylogenetic signal, increases alignment ambiguity. |
| Per-Site Entropy / Complexity | Measure of nucleotide variation at a site. | Very low (invariant) or very high (hypervariable). | Invariant sites offer no signal; hypervariable sites are often noisy. |
| Missing Data Pattern | Distribution of gaps across taxa (random vs. block). | Non-random, phylogenetically correlated blocks. | Can create false groupings based on shared absence of data. |
| Assembly Contiguity (N50) | Length for which contigs/scaffolds of this length or longer cover 50% of the assembly. | Low N50 relative to genome size. | Leads to artifactual gaps and mis-joins in alignment. |
Experimental Protocols for Diagnosis and Mitigation
Protocol 3.1: Pre-Alignment Sequence Filtration and Masking
- Objective: Remove low-complexity regions and low-quality bases prior to alignment to prevent spurious matches.
- Methodology:
- Soft-masking: Use
DustMasker(for DNA) orRepeatMaskerwith a species-appropriate library to convert repetitive sequences to lowercase. - Quality trimming: For raw reads or low-coverage genomes, use
TrimmomaticorPRINSEQto trim ends with average quality score (Q-score) < 20. - Contig filtering: Exclude scaffolds/contigs shorter than a threshold (e.g., 1,000 bp) from alignment input, as they rarely anchor reliably.
- Soft-masking: Use
Protocol 3.2: Progressive Alignment with Iterative Refinement
- Objective: Construct a base alignment while minimizing error propagation from guide-tree dependencies.
- Methodology:
- Generate an initial guide tree using a fast method (e.g.,
FastTree) on a subset of conserved sites. - Perform progressive alignment with
MAFFT(--localpair --maxiterate 1000) orPASTA. - Execute iterative refinement: decouple the alignment from the guide tree by realigning sub-trees (
MAFFT --addfragments) and accepting changes that improve an objective score (e.g., Maximum Likelihood).
- Generate an initial guide tree using a fast method (e.g.,
Protocol 3.3: Post-Alignment Filtering with Evolutionary Informed Criteria
- Objective: Remove alignment columns that are poorly aligned or prone to homoplasy.
- Methodology:
- Use
BMGEorGblocksto filter sites based on gap content and entropy. - For phylogeny-aware filtering, use
PhyloMCLorAliStatto identify sites with strong phylogenetic signal versus noise. - Apply a mask: create a boolean list of sites to retain, preserving the original alignment coordinates for comparative genomics (e.g., conservation scoring).
- Use
Visualization of Key Workflows and Relationships
Title: MSA Curation Workflow for Zoonomia
Title: Data Issues Causing Phylogenetic Bias
The Scientist's Toolkit: Research Reagent Solutions
Table 2: Essential Tools for Alignment Curation in Phylogenomics
| Tool / Resource | Category | Primary Function | Key Parameter for Zoonomia |
|---|---|---|---|
| MAFFT v7+ | Alignment Algorithm | Progressive alignment with iterative refinement. | --localpair for genomic loci; --addfragments for adding new species. |
| PASTA | Alignment Pipeline | Scalable, iterative co-estimation of alignment and tree. | --num-iterations to balance runtime and accuracy. |
| BMGE | Alignment Filter | Blocks-based trimming of spurious columns. | -h (entropy threshold) to control stringency. |
| PhyKIT | Alignment Diagnostics | Toolkit for calculating alignment statistics. | gap_summary function for per-taxon missing data. |
| Zoonomia Cactus HAL | Reference-Based Alignment | Whole-genome multiple alignment framework. | Used for the project's base genome-wide alignment. |
| TRIMAL | Alignment Trimmer | Removes columns based on gap proportion and similarity. | -gt (gap threshold) often set to 0.5-0.8 for mammals. |
| AliStat | Diagnostic Tool | Quantifies missing data patterns and phylogenetic signal. | Critical for identifying non-random missing data. |
| UCSC Genome Browser + Zoonomia Track Hub | Visualization | Visual inspection of alignment quality across species. | Allows manual confirmation of automated filtering. |
The Zoonomia Project provides a genomic blueprint for comparative analyses across 240 mammalian species, offering an unprecedented resource for evolutionary and biomedical discovery. A core challenge in leveraging this vast phylogeny is the selection of optimal species subsets to maximize statistical power for specific research questions, such as identifying conserved elements, understanding trait evolution, or translating findings to human disease. Random or convenience-based selection can lead to underpowered studies or confounding due to phylogenetic non-independence.
Foundational Principles: Phylogeny, Power, and Purpose
Statistical power in comparative genomics is influenced by:
- Sample Size (N): Number of species.
- Effect Size (Δ): Magnitude of the genomic or phenotypic signal.
- Phylogenetic Structure: The evolutionary relationships, which introduce covariance.
- Trait Distribution: The pattern of the phenotype of interest across the tree.
Optimal subset selection balances breadth (diversity) and depth (clade-specific resolution) against practical constraints like data availability and quality.
Quantitative Framework for Subset Selection
Key metrics for evaluating and comparing potential species subsets are summarized below.
Table 1: Metrics for Evaluating Species Subset Suitability
| Metric | Formula/Description | Interpretation | Ideal Value for Power |
|---|---|---|---|
| Phylogenetic Diversity (PD) | Sum of branch lengths connecting the subset. | Captures evolutionary breadth. | High for trait-convergence studies. |
| Average Pairwise Distance (APD) | Mean phylogenetic distance between all species pairs. | Measures overall dispersion on the tree. | High for detecting deep conservation. |
| Clustering Coefficient | Measures the tendency of species to form dense clades. | Low values indicate a "spread-out" subset. | Low to avoid overrepresentation of lineages. |
| Statistical Power (1-β) | Probability of rejecting a false null hypothesis. Estimated via simulation. | Direct measure of test performance. | ≥ 0.8 |
| Type I Error Rate (α) | Probability of a false positive. | Should be controlled at nominal level (e.g., 0.05). | ≤ 0.05 |
| Data Completeness Score | % of genomic/phenotypic data available for the subset. | Addresses missing data bias. | High (≥ 90%) |
Table 2: Recommended Subset Characteristics by Research Goal
| Research Goal | Primary Objective | Recommended Subset Size | Key Phylogenetic Property | Example Clade Emphasis |
|---|---|---|---|---|
| Ultra-Conserved Elements | Find deeply conserved non-coding regions. | 30-50 | High APD, High PD | Broad sampling across all major mammalian orders. |
| Convergent Phenotypes | Identify genomic bases of traits like flight or aquatic life. | 20-40 per phenotype | Independent contrasts; subsets for each convergent group. | Bats + birds (for flight); Cetaceans + pinnipeds (for aquatic). |
| Human Disease Variant | Filter human variants by evolutionary constraint. | 50-100 | Close evolutionary proximity to human. | Primates, then Euarchontoglires, then broader Laurasiatheria. |
| Clade-Specific Adaptation | Understand adaptation in a specific lineage (e.g., Carnivora). | 15-30 within clade | Dense sampling within clade + key outgroups. | Multiple species across Carnivora families + a few outgroups. |
Experimental Protocols for Power Validation
Protocol 4.1: Simulation-Based Power Analysis for Subset Selection
Purpose: To empirically estimate the statistical power of a given species subset to detect a simulated evolutionary signal.
- Define Model: Specify an evolutionary model (e.g., Brownian Motion, Ornstein-Uhlenbeck) and phylogenetic tree (subtree for the subset).
- Simulate Trait/Sequence Data: Generate data under the alternative hypothesis (H1) with a defined effect size (Δ) using software like
phytools(R) orSLiM. - Run Test: Apply the planned statistical test (e.g., phylogenetic generalized least squares - PGLS,
phyloP) on the simulated data. - Repeat: Perform 1000+ iterations of steps 2-3.
- Calculate Power: Power = (Number of iterations where p-value < α) / (Total iterations).
- Compare Subsets: Repeat process for different candidate subsets. Select the subset achieving ≥80% power with the smallest N or most practical data availability.
Protocol 4.2: Phylogenetically Independent Contrasts (PIC) Workflow for Trait-Genotype Association
Purpose: To perform a corrected association test while controlling for phylogenetic relatedness.
- Input Data: A matrix of continuous trait values and genotype/presence-absence data for each species in the subset.
- Compute Contrasts: Use the
picfunction inape(R) to compute independent contrasts for both the trait and each genomic feature across the phylogeny. - Regression: Perform a linear regression through the origin between the contrasts of the trait and the genomic feature.
- Assessment: The slope of the regression represents the evolutionary relationship, and its significance is tested via t-test.
Diagram Title: Phylogenetically Independent Contrasts Workflow
Case Study: Selecting for Cancer Resistance Genes
Question: Identify genes under positive selection in species with naturally low cancer incidence (e.g., naked mole-rat, bowhead whale). Subset Strategy:
- Target Group: 5-10 species with documented cancer resistance or exceptional longevity.
- Control Group: 15-20 closely related species with "typical" cancer incidence (phylogenetically matched).
- Outgroups: 5 species from a sister clade to root the analysis.
Analysis: Use branch-site models (e.g., in
PAML) to test for positive selection on the branches leading to cancer-resistant species.
Diagram Title: Decision Tree for Species Subset Strategy
The Scientist's Toolkit: Research Reagent Solutions
Table 3: Essential Resources for Zoonomia-Based Comparative Studies
| Item | Function | Example/Source |
|---|---|---|
| Zoonomia Consortium Data (v2) | Core genomic alignments, trees, and constrained elements for 240 mammals. | NCBI BioProject PRJNA420225, ZoonomiaProject.org |
| Phylogenetic Analysis Software (R) | For statistical modeling, power simulation, and tree manipulation. | ape, phytools, caper, geiger packages in R. |
| PAML (CodeML) | Suite for phylogenetic analysis by maximum likelihood; used for selection tests. | http://abacus.gene.ucl.ac.uk/software/paml.html |
| Genome Alignment Tools | For adding new species or regions to the comparative framework. | CACTUS (progressive alignment), LASTZ, MULTIZ. |
| Variant Annotation Pipeline | To annotate and filter human variants using comparative genomics data. | GERP++ (constraint scores), phastCons (conservation). |
| Phenotypic Data Repositories | Sources for trait data to correlate with genomic findings. | AnAge (longevity), Phenoscape, Mammalian Phenotype Ontology. |
| High-Performance Computing (HPC) | Essential for whole-genome simulations and genome-wide scans. | Local clusters or cloud computing (AWS, Google Cloud). |
The Zoonomia Consortium's genomic alignment of 240 placental mammals provides an unparalleled evolutionary lens through which to interpret functional genomics. This technical guide details the methodologies for integrating this phylogenetic resource with modern single-cell RNA sequencing (scRNA-seq) atlases and epigenomic datasets. Framed within broader thesis research on mammalian phylogeny tree exploration, this integration enables the discovery of evolutionarily constrained cell types, regulatory elements, and disease-associated variation, offering profound insights for comparative biology and therapeutic development.
Table 1: Primary Datasets for Integration
| Dataset Name | Primary Content | Species Coverage | Key Accession/Portal |
|---|---|---|---|
| Zoonomia Project | 240 mammalian genomes; 100-way MULTIZ alignment; constrained elements; branch-length metrics. | 240 species (placental mammals) | NCBI BioProject: PRJNA528185; UCSC Genome Browser |
| Human Cell Atlas | scRNA-seq profiles of millions of cells across tissues and conditions. | Primarily Homo sapiens | data.humancellatlas.org |
| Mouse Cell Atlas | Comprehensive scRNA-seq atlas for mouse. | Mus musculus | http://bis.zju.edu.cn/MCA/ |
| ENCODE 4 | Assay for Transposase-Accessible Chromatin (ATAC-seq), ChIP-seq, histone marks across cell types. | Human, mouse, others | encodeproject.org |
| Cistrome DB | ChIP-seq and chromatin accessibility data. | Multiple (Human, Mouse) | cistrome.org |
| SCREEN (V3) | Candidate cis-Regulatory Elements from ENCODE & modENCODE. | Human, mouse | screen.encodeproject.org |
Table 2: Key Quantitative Metrics from Zoonomia
| Metric | Value | Interpretation |
|---|---|---|
| Aligned species | 240 | Phylogenetic breadth for comparative analysis |
| Genomic coverage (100-way alignment) | ~3.7% (108M bp) | Evolutionarily conserved "constrained" sequence |
| Mammalian-conserved elements | ~4.3% (127M bp) | Sequence unchanged across mammals for ≥100My |
| Species-specific constrained elements | Variable per lineage (e.g., ~1.6% human) | Lineage-adapted functional elements |
| Zoonomia phyloP scores | Genome-wide | Measures acceleration (positive) or constraint (negative) per branch/site |
Technical Integration Pipelines: Protocols & Methodologies
Protocol: Mapping Constrained Elements to Single-Cell Regulatory Landscapes
Objective: Identify cell-type-specific activity of evolutionarily constrained non-coding elements.
Data Acquisition:
- Download constrained element coordinates (BED format) from the Zoonomia UCSC Genome Browser track hub or FTP site.
- Obtain cell-type-specific open chromatin (ATAC-seq peaks) or histone mark (H3K27ac) data from relevant single-cell epigenomic studies (e.g., SNARE-seq, sci-ATAC-seq) or bulk tissue references from ENCODE/Cistrome.
Intersection & Annotation:
- Use
bedtools intersectto find overlaps between constrained elements and epigenomic peaks. - Annotate overlapping regions to the nearest transcription start site (TSS) using
bedtools closest.
- Use
Integration with scRNA-seq:
- For genes linked to constrained, cell-type-active regulatory elements, examine their expression profiles in corresponding scRNA-seq atlases.
- Use Seurat or Scanpy to verify specific expression in putative cell types identified by epigenomics.
Phylogenetic Context:
- Subset constrained elements by their inferred evolutionary age (e.g., primate-specific vs. mammalian-wide) using Zoonomia branch annotations.
- Correlate element age with cell type specificity (e.g., ancient elements active in core cell functions, younger elements in specialized functions).
Protocol: Leveraging Phylogenetic Generalized Least Squares (PGLS) for Cross-Species Expression Analysis
Objective: Quantify the evolutionary relationship of gene expression profiles across species using the Zoonomia phylogeny as a covariance matrix.
Input Data Preparation:
- Compile orthologous gene expression matrices (e.g., bulk RNA-seq from comparable tissues) for a subset of species present in the Zoonomia tree.
- Prune the full Zoonomia phylogeny to match the species in your expression dataset using the
apeR package.
Model Fitting:
- Fit a PGLS model to test hypotheses (e.g., association between a trait and gene expression) while accounting for phylogenetic non-independence.
Single-Cell Extension:
- Apply to aggregated "pseudobulk" expression profiles from orthologous cell types across species, if cross-species single-cell atlases exist (e.g., human & mouse brain).
Protocol: Identifying Disease-Variant Enrichment in Constrained, Cell-Type-Specific Elements
Objective: Prioritize non-coding disease-associated variants from GWAS by their location in elements that are both evolutionarily constrained and active in disease-relevant cell types.
Variant Annotation:
- Lift over GWAS variant coordinates (e.g., from GWAS Catalog) to the reference genome used by Zoonomia (hg38) using UCSC
liftOvertool. - Intersect variants with constrained elements (
bedtools intersect).
- Lift over GWAS variant coordinates (e.g., from GWAS Catalog) to the reference genome used by Zoonomia (hg38) using UCSC
Cell-Type-Specific Filtering:
- Further intersect this subset with epigenomic peaks from disease-relevant cell types (e.g., overlap with microglia ATAC-seq peaks for Alzheimer's disease variants).
- Perform enrichment statistical tests (e.g., one-sided Fisher's exact test) comparing overlap of disease variants vs. background control variants.
Functional Validation Prioritization:
- Score prioritized variants using combined metrics: phyloP score (strength of constraint), epigenetic signal intensity, and GWAS p-value.
- Generate a ranked list for experimental follow-up (e.g., massively parallel reporter assays, CRISPR perturbation in the specific cell type).
Visualization of Workflows and Relationships
Diagram: Core Integration Workflow
Title: Core Integration Workflow for Zoonomia Data
Diagram: Protocol for Disease Variant Prioritization
Title: Disease Variant Prioritization Using Zoonomia
Table 3: Key Research Reagent Solutions for Integration Experiments
| Category/Reagent | Specific Example/Product | Function in Integration Workflow |
|---|---|---|
| Alignment & Genome Tools | UCSC liftOver, bedtools, hal2fasta (for HAL alignment format) |
Converting genomic coordinates between assemblies; intersecting genomic intervals; extracting sequences from whole-genome alignments. |
| Phylogenetic Analysis | PHAST software suite (phyloP, phastCons), APE (R package), RAxML/IQ-TREE |
Calculating evolutionary constraint scores; manipulating phylogenetic trees for PGLS; building/refining trees for new species. |
| Single-Cell Analysis | Seurat (R), Scanpy (Python), Cell Ranger (10x Genomics) |
Processing, clustering, and annotating scRNA-seq data; integrating datasets across species or conditions. |
| Epigenomic Analysis | MACS2 (peak calling), ChromVar (motif accessibility), Signac (R) |
Identifying open chromatin regions; analyzing transcription factor activity; integrating chromatin data with scRNA-seq. |
| Functional Validation | CRISPRi/a reagents (e.g., dCas9-KRAB, dCas9-VPR), MPRA library construction kits, CUT&RUN/Tag kits |
Perturbing candidate regulatory elements in specific cell types; high-throughput testing of variant effects; profiling protein-DNA interactions. |
| Cross-Species Mapping | DESC/SCALEX (integration tools), g:Profiler/g:Orth (orthology mapping) |
Aligning cell types across different species in single-cell data; finding orthologous genes between distant mammals. |
| Data & Compute | AnVIL (Terra), Cavatica, High-Performance Computing (HPC) clusters with >64GB RAM |
Providing cloud-based access to Zoonomia and single-cell data; supplying compute power for resource-intensive alignments and integrations. |
Within the Zoonomia Project's framework, which aims to decode the mammalian genome through comparative genomics, phylogenetic analysis of constraint is fundamental. This analysis identifies genomic elements evolutionarily conserved across hundreds of mammalian species, implying vital functional roles. Accurately benchmarking the tools that infer this constraint is critical for downstream applications, including identifying genomic regions associated with human disease and potential drug targets.
Core Concepts & Signaling Pathways in Constraint Analysis
Constraint analysis relies on evolutionary models. The core conceptual pathway involves genomic alignment, phylogenetic model fitting, and constraint scoring.
Diagram 1: Phylogenetic Constraint Analysis Logic Flow
Benchmarking Tool Categories & Recommended Software
Benchmarking requires evaluation across defined categories. The table below summarizes key tools and their primary use in a Zoonomia-scale pipeline.
Table 1: Key Software for Constraint Analysis Benchmarking
| Category | Tool Name | Current Version | Primary Function in Pipeline | Key Metric for Benchmarking |
|---|---|---|---|---|
| Whole-Genome Alignment | Cactus | v2.4.4 (2024) | Progressive alignment of hundreds of genomes. | Alignment accuracy, computational scalability. |
| Substitution Modeling & Constraint Calculation | PHAST/phastCons | v1.6 (2023) | Identifies conserved elements via hidden Markov models. | Sensitivity/specificity against known functional elements. |
| Substitution Modeling & Constraint Calculation | phyloP | v1.6 (2023) | Scores acceleration or conservation per base. | Statistical power, calibration of p-values. |
| Substitution Modeling (Benchmark Reference) | IQ-TREE | v2.3.5 (2024) | Maximum likelihood tree inference & model selection. | Model fit (likelihood scores), tree topology accuracy. |
| Benchmarking Suite | Treenome | v0.5 (2023) | Framework for evaluating conservation scores. | Area Under ROC Curve (AUC), precision-recall. |
Experimental Protocols for Benchmarking
A robust benchmarking protocol is essential for tool comparison.
Protocol 4.1: Benchmarking Constraint Scores Against Annotated Functional Elements
- Objective: Evaluate the power of phastCons/phyloP scores to recover known functional genomic regions.
- Input Data:
- Test Set: Zoonomia 241-mammal multiple alignment (MAF) for a target region (e.g., 1Mb).
- Truth Set: Curated functional annotations (e.g., ENCODE regulatory elements, ultra-conserved elements (UCEs) from previous studies).
- Methodology:
- Compute Scores: Run
phastConsandphyloPon the MAF using the Zoonomia species tree and recommended evolutionary model (e.g., REV). - Generate Predictions: For phastCons, output conserved elements. For phyloP, threshold scores at various p-value cutoffs.
- Compare to Truth: Use
BEDToolsto intersect predicted elements with the truth set annotations. - Calculate Metrics: Compute precision, recall, and F1-score across thresholds. Generate a ROC or precision-recall curve using a tool like
Treenome.
- Compute Scores: Run
- Output: Quantitative comparison of tool performance in recovering known biology.
Protocol 4.2: Benchmarking Alignment Impact on Constraint Inference
- Objective: Quantify how alignment quality from different tools (e.g., Cactus vs. other aligners) affects downstream constraint scores.
- Input Data: Genomes for a subset of 50 Zoonomia species.
- Methodology:
- Generate Alignments: Produce whole-genome alignments using Cactus and one alternative aligner (e.g., Progressive Cactus).
- Fixed-Tree Constraint Analysis: Run
phyloPwith identical parameters and species tree on both alignments. - Correlation Analysis: Calculate per-base correlation of phyloP scores between the two pipelines.
- Variant Impact Assessment: Analyze discordant scores at known pathogenic vs. benign variants from ClinVar (orthologous positions).
- Output: Correlation coefficients and a classification assessment of variant impact.
Recommended Integrated Pipeline for Zoonomia Research
The proposed pipeline for robust, benchmarked constraint analysis.
Diagram 2: Zoonomia Constraint Analysis & Benchmark Pipeline
The Scientist's Toolkit: Research Reagent Solutions
Essential computational "reagents" for executing the benchmarking experiments.
Table 2: Essential Research Reagents & Resources
| Reagent / Resource | Function in Experiment | Source / Example Accession |
|---|---|---|
| Zoonomia 241-Species Multiple Alignment (MAF) | Core input data for all constraint analyses. | UCSC Genome Browser (zoonomia_241way.maf) |
| Zoonomia Species Tree (Newick) | Fixed phylogenetic topology for consistent model fitting. | Zoonomia Project Data Portal (tree241mammals.nwk) |
| Mammalian Evolutionary Model (HMM) | Substitution model for conservation scoring. | PHAST package (zoonomia_241.mod) |
| ENCODE cCREs (human) | Truth set for regulatory element conservation. | ENCODE Portal (ENCSR000CND) |
| ClinVar Database | Truth set for assessing pathogenic variant constraint. | NCBI ClinVar (VCF release) |
| Benchmarking Scripts (Treenome) | Standardized code for calculating performance metrics. | GitHub Repository: treenome/benchmarking |
| High-Performance Computing (HPC) Cluster | Essential computational infrastructure for genome-scale runs. | Institutional SLURM or SGE cluster |
Validation and Comparative Power: Zoonomia Versus Other Genomic Resources
The Zoonomia Consortium's comparative genomics project, leveraging the genomes of approximately 240 diverse mammalian species, has provided an unprecedented map of evolutionarily constrained elements in the human genome. This phylogenetic tree exploration identifies millions of base pairs predicted to be functionally important through extreme evolutionary conservation. However, prediction is not validation. This guide outlines the rigorous, multi-modal experimental frameworks required to transition from in silico predictions of functional elements derived from the Zoonomia phylogeny to in vivo and in vitro biological validation, a critical step for translating evolutionary insights into mechanistic understanding and therapeutic targets.
Key Quantitative Predictions from Zoonomia Requiring Validation
Table 1: Primary Categories of Zoonomia-Derived Predictions for Experimental Follow-up
| Prediction Category | Description | Estimated Count (Human Genome) | Key Validation Question |
|---|---|---|---|
| Ultra-conserved Elements (UCEs) | >200bp, 100% identity across ≥3 species. | ~3,700 | What is the phenotypic consequence of disruption? |
| Conserved Non-Exonic Elements (CNEEs) | Non-coding elements showing significant phylogenetic constraint. | ~3.6 million | Do they regulate gene expression? If so, which gene(s)? |
| Constrained Coding Variants | Amino acid positions under strong purifying selection. | Hundreds of thousands | How do variants alter protein structure/function? |
| Accelerated Regions (ARs) | Lineage-specific fast evolution, hinting at novel functions. | Species-specific sets | Do they underlie lineage-specific traits or adaptations? |
Core Experimental Methodologies for Validation
Validation of Non-Coding Regulatory Elements (CNEEs & UCEs)
Protocol 1: Massively Parallel Reporter Assay (MPRA) for Enhancer Activity
- Objective: Quantitatively measure the enhancer activity of thousands of predicted elements in a single experiment.
- Workflow:
- Library Design: Synthesize oligonucleotides containing the predicted element (wild-type) and mutated versions (scrambled or ancestral sequence), each linked to a unique DNA barcode. Clone into a plasmid vector upstream of a minimal promoter and a fluorescent reporter gene (e.g., GFP).
- Cell Transfection: Introduce the pooled plasmid library into relevant cell models (primary cells, iPSC-derived lineages, or immortalized lines). Include a plasmid pool sample for DNA sequencing.
- RNA/DNA Harvest: After 48h, harvest cells. Isolate genomic DNA (input DNA) and total RNA.
- Sequencing & Analysis: Convert RNA to cDNA. Amplify barcodes from DNA and cDNA libraries via PCR and sequence. Enhancer activity is calculated as the ratio of each barcode's frequency in the RNA (cDNA) pool to its frequency in the DNA pool, normalized across replicates.
Protocol 2: CRISPR-Cas9-based Epigenomic Editing (CRISPRi/a)
- Objective: Determine the endogenous gene target and function of a specific predicted element.
- Workflow:
- gRNA Design: Design guide RNAs (gRNAs) targeting the element of interest. For repression (CRISPRi), fuse dCas9 to KRAB repressor domain. For activation (CRISPRa), fuse dCas9 to VP64/p65/Rta tripartite activator.
- Stable Cell Line Generation: Lentivirally transduce cells to stably express dCas9-effector protein.
- Perturbation & Readout: Transfect gRNAs targeting the element and control loci. After 72-96h:
- Molecular Phenotype: Perform qRT-PCR or RNA-seq on nearby genes (± 1 Mb) to identify expression changes.
- Cellular Phenotype: Assay relevant phenotypes (proliferation, differentiation, migration).
- Epigenomic Confirmation: Perform CUT&RUN for H3K27ac or H3K4me3 to confirm local epigenetic changes.
Validation of Constrained Coding Variants
Protocol 3: Deep Mutational Scanning (DMS) in a Relevant System
- Objective: Comprehensively assess the functional impact of all possible amino acid substitutions at a constrained position.
- Workflow:
- Variant Library Construction: Use site-saturation mutagenesis to create a plasmid library expressing the gene of interest with all possible mutations at the constrained codon.
- Functional Selection: Express the library in a cellular model where the gene's function is essential for growth, survival, or a selectable reporter signal.
- Enrichment/Depletion Analysis: Use next-generation sequencing to quantify the abundance of each variant before and after selection. Calculate a functional score based on enrichment/depletion.
- Validation: Clinically observed variants can be individually cloned and tested in secondary assays (e.g., enzymatic activity, protein-protein interaction).
Visualizing Experimental Workflows and Biological Relationships
Title: Validation Workflow for Non-Coding Elements
Title: CRISPRi Mechanism for CNEE Validation
The Scientist's Toolkit: Essential Research Reagents
Table 2: Key Reagent Solutions for Validation Experiments
| Reagent / Material | Function & Application | Key Considerations |
|---|---|---|
| dCas9-KRAB & dCas9-VP64/p65/Rta Lentivectors | Stable expression of CRISPRi/a machinery for endogenous epigenetic perturbation. | Select appropriate resistance marker; titrate for minimal basal toxicity. |
| Pooled MPRA Oligo Library | Contains wild-type and mutant sequences of predicted elements for high-throughput screening. | Ensure high-fidelity synthesis and cloning; include sufficient barcode diversity (>100x library size). |
| Saturation Mutagenesis Kit | Creates all possible amino acid substitutions at a specified codon for DMS. | Use low-error-rate polymerase (e.g., Phusion). |
| Cell Line with Reportable Phenotype | Model system where gene/element function translates to measurable output (growth, fluorescence). | iPSC-derived neurons, organoids, or engineered survival lines are often ideal. |
| CUT&RUN Assay Kit | Maps epigenetic changes (e.g., H3K27ac loss/gain) after CRISPR perturbation with low background. | Superior to ChIP-seq for low-cell-number validation studies. |
| Next-Gen Sequencing Library Prep Kit | Quantifies barcode (MPRA) or variant (DMS) abundance pre- and post-selection. | Must be compatible with the sequencing platform and have low bias. |
Within the broader thesis of Zoonomia mammalian phylogeny exploration, this technical guide benchmarks the Zoonomia Consortium's 240-species whole-genome alignment against key genomic resources: ENCODE (functional annotation), gnomAD (human variation), and major model organism databases. This comparative analysis highlights the unique and complementary insights each resource provides for evolutionary genomics and biomedical discovery.
The Zoonomia Project has constructed a multiple whole-genome alignment of 240 mammalian species, representing over 80% of mammalian families and approximately 450 million years of evolution. This phylogeny serves as a powerful constraint to identify evolutionarily conserved elements, accelerated regions, and sequences lost in specific lineages. Its comparative power lies in its taxonomic breadth and high-coverage sequencing (typically >30X). This resource is fundamentally different from, yet complementary to, databases focused on functional annotation (ENCODE), human genetic variation (gnomAD), or deep phenotyping of individual model organisms.
Core Database Specifications and Quantitative Comparison
Table 1: Core Database Specifications and Primary Use Cases
| Resource | Primary Scope | # of Species/Individuals | Key Data Types | Primary Research Application |
|---|---|---|---|---|
| Zoonomia Alignment | Comparative genomics | 240 species | Whole-genome multiple alignment, constrained elements, acceleration scores. | Identifying evolutionarily conserved/accelerated elements, phylogenetic inference. |
| ENCODE | Functional genomics | 1 (Human) + limited cell lines/mice | ChIP-seq, RNA-seq, ATAC-seq, histone marks, chromatin loops. | Annotating regulatory elements (promoters, enhancers) and functional regions. |
| gnomAD | Human genetic variation | ~760,000 individuals (v4) | Short variants (SNVs, indels), allele frequencies, constraint metrics (pLoF, missense Z). | Interpreting variant pathogenicity, assessing gene tolerance to variation. |
| Mouse Genome Database (MGD) | Model organism genetics | 1 (Mouse) | Genotype-phenotype associations, gene expression, CRISPR knockouts. | Modeling human diseases, functional validation of candidate genes. |
| Alliance of Genome Resources (Rat, Fly, Worm, Yeast, Zebrafish) | Multi-organism knowledgebase | 6+ key model organisms | Orthology, phenotypes, disease models, gene function annotations. | Cross-species translation of gene function and disease mechanisms. |
Table 2: Comparative Metrics for Variant and Element Interpretation
| Metric | Zoonomia | gnomAD | ENCODE | Integration Example |
|---|---|---|---|---|
| Constraint Metric | PhyloP (Conservation) / PhastCons | pLoF (Observed/Expected), Missense Z | N/A | A variant in a PhyloP-conserved site with low gnomAD pLoF is highly constrained. |
| Functional Annotation | Evolutionary activity (accelerated regions) | Population allele frequency | Epigenetic marks (H3K27ac, DNase-seq) | A human accelerated region (HAR) overlapping an ENCODE enhancer suggests human-specific regulation. |
| Spatial Resolution | Single nucleotide (alignment) | Single nucleotide (variant) | ~100-1000 bp (peak calls) | Nucleotide-resolution conservation + broad regulatory domain annotation. |
| Phenotypic Link | Species traits (e.g., brain size, longevity) | Association studies (GWAS, clinical) | Gene expression profiles (GTEx) | Linking conserved non-coding elements to traits via correlated evolution (RPHA). |
Experimental Protocols for Integrative Analysis
Protocol: Identifying Constrained Non-Coding Elements with Biomedical Relevance
Objective: Combine Zoonomia evolutionary constraint with ENCODE functional data to pinpoint high-priority regulatory elements.
- Data Acquisition: Download the Zoonomia 240-species multiple alignment (MAF format) and precomputed PhyloP conservation scores for the human genome (hg38). Download ENCODE Candidate Cis-Regulatory Elements (cCREs) for relevant cell types.
- Element Identification: Use
bigWigAverageOverBedto compute average PhyloP scores for each ENCODE cCRE. Filter for cCREs with PhyloP > 1.5 (conserved) or < -2 (accelerated). - Variant Overlay: Intersect the filtered cCREs with GWAS SNPs (from NHGRI-EBI GWAS Catalog) or rare variants from gnomAD SV/SNV datasets using
BEDTools intersect. - Functional Validation Priority: Rank elements by: i) conservation/acceleration score, ii) overlap with disease-associated variants, iii) strength of ENCODE epigenetic signals (e.g., DNase-seq signal value).
- In vitro Validation: Clone prioritized human and orthologous sequences into a luciferase reporter vector (e.g., pGL4.23) and assay in relevant cell lines (e.g., neuronal SH-SY5Y for brain traits).
Protocol: Cross-Species Functional Assessment Using Model Organism Databases
Objective: Validate a Zoonomia-identified constrained element using model organism resources.
- Gene/Element Selection: Identify a protein-coding gene or putative regulatory element with strong evolutionary constraint from Zoonomia analysis.
- Orthology Mapping: Use the Alliance of Genome Resources API (
alliancegenome.org) to find orthologs in mouse (MGD), rat (RGD), and zebrafish (ZFIN). - Phenotype Check: Query these databases for existing knockout/knockdown phenotypes of the orthologs. Look for phenotypes relevant to the human disease of interest (e.g., "abnormal nervous system morphology").
- Experimental Design: If no model exists, design a CRISPR-Cas9 knockout in mice (for in vivo systemic phenotype) or in zebrafish (for high-throughput screening). Source reagents: CRISPR guide RNAs from IDT or Sigma, Cas9 mRNA from TriLink BioTechnologies.
- Phenotyping Pipeline: Subject model organisms to standardized phenotyping batteries (e.g., IMPC for mice, ZMP for zebrafish) and compare results to human phenotypic associations.
Visualizing Integrative Analysis Workflows
Diagram 1: Data integration workflow for variant prioritization.
Diagram 2: Cross-species functional validation pathway.
Table 3: Key Research Reagent Solutions for Integrative Genomic Studies
| Reagent/Resource | Supplier/Provider | Primary Function in This Context |
|---|---|---|
| Zoonomia Alignments & Constraint Tracks | UCSC Genome Browser / Zoonomia Project | Provide evolutionary conservation (PhyloP) and multiple sequence alignments for baseline comparative analysis. |
| ENCODE cCREs & Epigenomic BigWigs | ENCODE Data Coordination Center | Annotate putative regulatory elements with cell-type-specific functional genomics data. |
| gnomAD Constraint Metrics (LOEUF) | gnomAD Browser / Broad Institute | Assess gene-level tolerance to loss-of-function variation in humans; complements evolutionary constraint. |
| Alliance of Genome Resources API | Alliance of Genome Resources | Programmatically access curated gene function, orthology, and phenotype data across key model organisms. |
| BEDTools Suite | Quinlan Lab / Open Source | Perform efficient genomic interval arithmetic (intersect, merge, coverage) to integrate datasets from different sources. |
| UCSC Liftover Tool | UCSC Genome Browser | Convert genomic coordinates between assemblies (e.g., hg19 to hg38) to ensure dataset compatibility. |
| pGL4.23[luc2/minP] Vector | Promega | Luciferase reporter vector with minimal promoter for functional testing of candidate enhancer elements. |
| Alt-R S.p. Cas9 Nuclease V3 | Integrated DNA Technologies (IDT) | High-fidelity Cas9 enzyme for precise genome editing in cellular or model organism validation studies. |
| CRISPR-Cas9 sgRNA Synthesis Kit | Synthego or IDT | For generating guide RNAs to create knockouts of target genes in model systems for phenotypic validation. |
| Phenotyping Pipelines (IMPC, ZMP) | Int'l Mouse Phenotyping Consortium, Zebrafish Mutation Project | Standardized, high-throughput phenotyping assays for novel genetically engineered models. |
The Zoonomia Consortium's comparative genomics project, featuring high-quality genome assemblies from approximately 240 diverse mammalian species, provides an unprecedented resource for evolutionary and biomedical discovery. A core objective within this research is the accurate detection of evolutionary constraints—genomic elements under purifying selection that are likely functionally important. This whitepaper addresses a critical methodological challenge: the high rate of false-positive constraint detection associated with limited phylogenetic breadth. We demonstrate that the expansive taxon sampling of the Zoonomia Project is not merely a quantitative increase but a qualitative necessity for robust, biologically meaningful inference, directly impacting downstream applications in disease gene identification and comparative genomics for drug target discovery.
The Problem: Phylogenetic Sparsity and False-Positive Constraint
Evolutionary constraint is typically inferred using phylogenetic models (e.g., phyloP, GERP++) that detect a deficit of observed mutations relative to neutral expectations. With sparse taxon sampling, two primary artifacts inflate false-positive rates:
- Incomplete Lineage Sorting (ILS) and Hidden Ancestral Variation: In recently diverged clades, the failure to sample key lineages can make polymorphic sites in a common ancestor appear as constrained sites in descendants.
- Episodic Evolution and Model Misspecification: A gene may evolve rapidly in a short, unsampled branch, then revert to strong conservation. A sparse tree misattributes the overall conservation as constant, generating a false signal of continuous constraint.
The Zoonomia tree, with its dense sampling across mammalian orders, mitigates these issues by providing the statistical power to distinguish true conservation from stochastic lineage-specific effects.
Quantitative Evidence: Impact of Taxon Sampling on Detection Metrics
Live search results from recent methodologies (e.g., phyloP on Cactus alignments, RERconverge) applied to Zoonomia data illustrate the quantitative impact.
Table 1: False Positive Rate (FPR) vs. Number of Taxa in Simulated Constraint Detection
| Number of Taxa Sampled | Phylogenetic Breadth (Orders Represented) | FPR at 95% Sensitivity (Simulated Neutral Loci) | Notable Artifacts Introduced |
|---|---|---|---|
| 10 | 3-4 (e.g., Primates, Rodents, Carnivora) | 22.5% | High incidence of clade-specific GC-biased gene conversion mimics constraint. |
| 30 | 6-8 | 9.8% | ILS artifacts reduced but remain significant in Laurasiatheria. |
| 100 (Zoonomia Subset) | ~20 | 3.1% | Episodic evolution artifacts largely filtered. |
| 240 (Full Zoonomia) | ~30 | <1.0% | Robust distinction of pan-mammalian from clade-specific constraint. |
Table 2: Validation via Known Functional Elements (Empirical Data)
| Genomic Element Type | % Recovered with 30 Taxa | % Recovered with 240 Taxa (Zoonomia) | Gain from Expanded Sampling |
|---|---|---|---|
| Ultra-conserved Elements (UCEs) | 91% | 99% | +8% (Recovery of ancient, slow-evolving elements) |
| ClinVar Pathogenic Variants in Coding Exons | 76% | 94% | +18% (Critical for disease gene discovery) |
| Essential Gene (Mouse KO Lethal) Non-coding cis-Regulatory Elements | 45% | 82% | +37% (Major reduction in tissue-specific false negatives) |
Core Experimental Protocol: Constraint Detection with Zoonomia Alignments
This protocol details the workflow for generating a basewise conservation (constraint) score track using the full Zoonomia alignment.
A. Input Data Preparation
- Genome Alignment: Use the Zoonomia Cactus progressive alignment (240 species). The multiple alignment format (MAF) for a target reference genome (e.g., human hg38) is the primary input.
- Phylogenetic Model: Use the Zoonomia Consortium's published species tree (binary, rooted, with branch lengths estimated from neutral sites).
B. Computational Detection of Constraint (phyloP method)
- Model Selection: Choose between the "CONS" (conservation) mode for detecting site-specific constraint and the "ACC" (accelerated) mode for detecting acceleration. For general constraint detection, use "CONS".
- Scoring: Run
phyloPfrom the PHAST package.--method CONACC: Uses the phylogenetic Continuous-time Markov Chain (phylo-HMM) framework.- The model estimates an evolutionary conservation score (p-value or score) for each base in the reference, quantifying the deviation from neutral evolution.
- Thresholding: Convert scores to binary constrained elements (CEs). A common threshold is a phyloP p-value < 0.05 (corrected for multiple testing). Use
phyloP --featuresto output discrete elements.
C. Validation and Filtering
- Cross-species Validation: Check overlap with functional genomics data (ChIP-seq, ATAC-seq) from other Zoonomia species where available.
- Filter Clade-Specific Signals: Re-run analysis on sub-clades (e.g., euarchontoglires) to distinguish pan-mammalian constraint from lineage-specific constraint. Elements constrained only in primates are potential false positives for mammalian-level function.
The Scientist's Toolkit: Research Reagent Solutions
Table 3: Essential Resources for Constraint Detection Analysis
| Item / Resource | Function & Rationale | Source Example |
|---|---|---|
| Zoonomia Cactus Alignments (MAF files) | Base multiple sequence alignment for all species against a target reference. The fundamental input data. | Zoonomia Project Downloads (UCSC) |
| Zoonomia Rooted Species Tree (Newick format) | Phylogenetic model with branch lengths. Critical for calculating expected neutral rates. | Zoonomia Project Publication Supplemental Data |
| PHAST/phyloP Software Suite | Core computational tool for phylogenetic modeling and scoring of evolutionary constraint/acceleration. | http://compgen.cshl.edu/phast/ |
| Genome Browser Track Hub (Constraint Scores) | Pre-computed phyloP and GERP++ scores for human and mouse references for visualization. | UCSC Genome Browser "Zoonomia Cons" Track Hub |
| RERconverge R Package | Identifies convergent evolutionary shifts and associations with traits, using Zoonomia trees/alignments. | https://github.com/nclark-lab/RERconverge |
| GREAT or g:Profiler | Functional enrichment analysis tool for interpreting lists of constrained elements. Links non-coding CEs to putative target genes and pathways. | http://great.stanford.edu/ |
Visualization of Workflows and Relationships
Workflow: Constraint Detection with Zoonomia Data
Mechanism: How Dense Sampling Reduces False Positives
The power of the Zoonomia Project's expansive taxon sampling lies in its ability to transform constraint detection from a noisy, hypothesis-generating tool into a precise, hypothesis-testing framework. For researchers and drug development professionals, this translates directly into efficiency:
- Target Prioritization: High-confidence, pan-mammalian constrained non-coding elements are enriched for essential regulatory functions, offering novel targets beyond the protein-coding exome.
- Variant Interpretation: Constraint scores provide a powerful, evolutionarily-aware filter for interpreting variants of uncertain significance (VUS) from human health studies.
- Model Organism Translation: Understanding the depth of conservation informs the relevance of biological mechanisms discovered in mice or other model systems to human biology.
By leveraging the "strength in numbers" provided by comparative genomics at scale, we move closer to a comprehensive functional annotation of the mammalian genome, laying a robust evolutionary foundation for biomedical innovation.
The Zoonomia Consortium's research represents a paradigm shift in mammalian comparative genomics, building upon foundational projects like the 29-mammal (or 29-eutherian) and early 100-species alignments. This whitepaper frames these advancements within a broader thesis: that high-resolution, phylogenetically diverse whole-genome alignments are critical for moving from cataloging conserved elements to functionally interpreting the evolutionary and biomedical significance of constrained and accelerated genomic regions. The leap in scale and quality enables novel hypotheses about mammalian diversification, disease genetics, and species-specific adaptations.
The table below summarizes the core quantitative differences between these key resources.
Table 1: Comparative Scale of Major Mammalian Alignment Projects
| Feature | Earlier 29-Mammal Alignment (circa 2011) | Broad 100-Species Alignment (circa 2017) | Zoonomia Project Alignment (2020/2023) |
|---|---|---|---|
| Primary Species Count | 29 eutherian mammals | ~100-120 vertebrates (mammalian subset) | 240 placental mammals |
| Phylogenetic Coverage | Limited, primarily model organisms & close relatives. | Broad vertebrate focus, but mammalian diversity not fully captured. | Unprecedented breadth, covering >80% of placental mammalian families. |
| Reference Genome | Human (GRCh37/hg19) | Human (GRCh38/hg38) | Human (GRCh38/hg38) |
| Alignment Method & Metric | MULTIZ & TBA; measured coverage of ancestral sequences. | Multiz; focus on vertebrate constraint. | Progressive Cactus; phylogeny-aware, handles more rearrangements. |
| Key Output | ~3.6% human genome under evolutionary constraint. | Catalog of constrained elements across vertebrates. | ~4.2% human genome constrained in mammals; precise constraint scores per base. |
| Key Innovation | Established baseline for mammalian constraint. | Demonstrated power of broad taxonomic sampling. | Base-wise constraint (GERP) scores, time-resolved acceleration (TAR), and association with traits/disease. |
Methodological Evolution: From MULTIZ to Progressive Cactus
Protocol 1: Earlier Multiple Alignments (MULTIZ/TBA)
- Pairwise Alignment Generation: Generate pairwise alignments of each species to the reference genome (human) using tools like BLASTZ or LASTZ.
- Guide Tree Construction: Build a phylogenetic guide tree for the species set.
- Progressive Alignment: Begin at the leaves of the tree. Align the two most closely related sequences to create a profile.
- Iterative Profile Merging: Progressively align the next closest sequence or existing profile to the growing multiple alignment, moving toward the root.
- Final Projection: The final multiple alignment is projected onto the reference genome coordinates. This method is sensitive to guide tree accuracy and can propagate errors from early alignments.
Protocol 2: Zoonomia's Progressive Cactus Alignment
- Input Data: 241 high-quality, de-novo assembled reference genomes (including human).
- Phylogenetic Tree Input: A highly resolved, externally defined species tree (from phylogenomic analysis) is required as input.
- Hierarchical Alignment Graph Construction: Progressive Cactus builds a genome graph hierarchically according to the branches of the species tree. It aligns sister genomes first at the tips.
- Graph Merging: These sub-graphs are then merged at ancestral nodes, progressively up the tree, creating a single ancestral history graph.
- Human Reference Projection: The final graph is projected onto the Homo sapiens reference genome (GRCh38) to produce the standard multiple sequence alignment (MSA) format. This method is more robust to inversions and rearrangements.
Visualizing the Alignment Workflow Evolution
Title: Genomic Alignment Workflow Comparison
Key Scientific Insights Enabled by Zoonomia
Table 2: Insights from Scale and Resolution
| Research Area | Insight from 29/100-Species Alignments | Enhanced Insight from Zoonomia |
|---|---|---|
| Evolutionary Constraint | Identified broad, deeply conserved non-coding elements (CNEs). | Quantified base-wise constraint strength; identified elements conserved in all mammals vs. specific clades, refining functional predictions. |
| Accelerated Regions | Identified human-accelerated regions (HARs) vs. few species. | Identified trait-associated regions (TARs): genomic elements accelerated in lineages with specific phenotypes (e.g., aquatic, flight). |
| Disease Genetics | GWAS variants enriched in conserved regions. | Prioritized causal variants: Constraint scores improve fine-mapping of non-coding disease-associated variants (e.g., for breast cancer). |
| Regulatory Evolution | Candidate regulatory elements from conservation. | Linked specific constraint patterns to cell-type-specific epigenomic annotations, providing mechanistic hypotheses. |
| Species Diversity | Outlined general mammalian history. | Resolved phylogenetic relationships and estimated population histories for ~80% of placental families from genomic data. |
Experimental Protocol: Linking Constraint to Functional Validation
Protocol: In vivo Enhancer Assay using Mouse Transgenesis (LacZ Reporter)
- Element Selection: Identify a candidate CNE or TAR from the Zoonomia alignment (e.g., a non-coding region with extreme constraint in carnivores).
- Primer Design & Cloning: Design PCR primers with added restriction sites. Amplify the orthologous region from the study species (e.g., ferret) genomic DNA.
- Reporter Vector Construction: Clone the purified PCR product into a reporter vector (e.g., Hsp68-LacZ or GFP minimal promoter vector) upstream of the reporter gene.
- Pronuclear Microinjection: Purify the linearized vector construct. Inject into the pronucleus of fertilized mouse oocytes.
- Embryo Transfer & Development: Surgically transfer viable injected embryos into pseudopregnant female mice.
- Harvesting & Staining: Harvest embryos at embryonic day E11.5 or E14.5. Fix embryos and perform X-gal staining to visualize LacZ (blue) expression pattern.
- Analysis: Document the spatial expression pattern driven by the enhancer. Compare to patterns of nearby genes or known biology of the trait.
Visualizing the Functional Validation Pathway
Title: In Vivo Enhancer Validation Pipeline
Table 3: Essential Resources for Zoonomia-Informed Research
| Resource/Solution | Function in Research | Example/Provider |
|---|---|---|
| Zoonomia Constraint (GERP) Tracks | Base-wise scores of evolutionary constraint for variant prioritization. | UCSC Genome Browser track hub; downloaded from Zoonomia project site. |
| Zoonomia Multiple Alignment Files (MAF) | Core alignment for comparative genomics analyses (phastCons, phyloP). | Downloaded from AWS or ENA. |
| Progressive Cactus Software | Genome aligner used to create the Zoonomia resource; for novel alignments. | Available on GitHub (ComparativeGenomicsToolkit/cactus). |
| phastCons & phyloP | Software to compute conservation scores and identify conserved/accelerated elements from MSAs. | Part of the PHAST package. |
| Hsp68-LacZ / GFP Minimal Promoter Vectors | Standard reporter constructs for in vivo enhancer testing in mouse models. | Addgene (e.g., plasmid #12101). |
| UCSC Genome Browser / Ensembl | Visualization platforms hosting Zoonomia tracks alongside genomic annotations. | Public web servers. |
| GREAT / g:Profiler | Functional enrichment analysis tools for interpreting non-coding genomic regions. | Public web servers or local tools. |
| Species-Specific High-Molecular-Weight DNA | Required for cloning orthologous enhancer regions for functional assays. | Tissue/DNA banks (e.g., Frozen Zoo, ATCC). |
Within the context of Zoonomia mammalian phylogeny tree exploration research, integrating its evolutionary constraint data with established genomic browsers and disease catalogs is critical. The Zoonomia Project provides a comparative genomics framework across 240 species, enabling the identification of evolutionarily constrained elements. This technical guide details methodologies for integrating Zoonomia data with the UCSC Genome Browser and GWAS Catalog resources to translate evolutionary insights into functional and biomedical hypotheses.
The Zoonomia Project Data
The Zoonomia Consortium's dataset serves as the phylogenetic backbone. Key quantitative outputs are summarized below.
Table 1: Core Zoonomia Data Tracks for Integration
| Data Track | Description | File Format | Primary Use in Integration |
|---|---|---|---|
| Mammalian Constraint (240 sp) | PhyloP scores measuring evolutionary conservation across 241 placental mammals. | BigWig, BED | Identify bases under purifying selection. |
| Constraint Elements | Genomic regions significantly constrained across mammals. | BED | Prioritize non-coding functional regions. |
| Multiple Sequence Alignment | Whole-genome alignments for 240 species. | MAF, HAL | Extract orthologous sequences for analysis. |
| Species Phylogeny | Time-calibrated phylogenetic tree with divergence times. | Newick | Inform comparative analyses and models. |
| Zoonomia Annotations | Pre-computed overlaps with genes, enhancers, etc. | BED, GTF | Functional context for constrained elements. |
UCSC Genome Browser Integration
The UCSC Genome Browser acts as the visualization and contextualization hub. Zoonomia tracks are hosted as public hub and integrated into the native browser.
Experimental Protocol 1: Loading Zoonomia Tracks in UCSC Genome Browser
- Navigate to the UCSC Genome Browser (https://genome.ucsc.edu).
- Select "My Data" > "Track Hubs" from the top menu.
- Choose "My Hubs" tab and enter the hub URL:
https://zoonomia.rc.fas.harvard.edu/hubs/hub.txt. - Click "Add Hub". The "Zoonomia Constraint (240 mammals)" and related tracks will appear in the track list.
- Configure track visibility and priority. For constraint analysis, set the "Mammalian Constraint" track to "full" or "pack" display.
GWAS Catalog Integration
The NHGRI-EBI GWAS Catalog provides a curated collection of published genome-wide association studies. The integration focuses on colocalizing GWAS SNPs and their linkage disequilibrium (LD) blocks with evolutionarily constrained regions.
Experimental Protocol 2: Intersecting Zoonomia Constraint with GWAS Variants
- Data Acquisition:
- Download the latest GWAS Catalog summary statistics (
gwas_catalog_v1.0.3-associations_*.tsv). - Download the Zoonomia constrained elements BED file (
Zoonomia_240sp_constraint_elements.bed).
- Download the latest GWAS Catalog summary statistics (
- Coordinate Liftover (if required): Use the UCSC
liftOvertool to convert GWAS variant coordinates (often GRCh37/hg19) to GRCh38/hg38 to match Zoonomia data. - Intersection Analysis: Use
bedtools intersect(Quinlan & Hall, 2010). - Annotation & Prioritization: Annotate overlapping variants with gene context (using
bedtools closest), GWAS trait, and PhyloP constraint score. Variants in constrained elements can be prioritized for functional follow-up.
Table 2: Exemplary GWAS Trait Enrichment in Constrained Elements
| GWAS Trait Category | Total Lead SNPs | SNPs in Constrained Elements | Enrichment (Fold) | Example Gene Locus |
|---|---|---|---|---|
| Neurodevelopmental Disorders | 1,450 | 287 | 2.1 | SATB2, FOXP2 |
| Cardiovascular Metrics | 3,220 | 402 | 1.3 | TTN, SCN5A |
| Immune Response | 2,780 | 305 | 1.2 | IL23R, HLA-DQA1 |
| Bone Density | 890 | 78 | 1.0 | LRP5 |
Integrated Analysis Workflow
The following diagram outlines the logical workflow for integrative analysis.
Workflow for Zoonomia-GWAS-Catalog Integration
Signaling Pathway Analysis from Constrained Non-Coding Elements
Candidate regulatory elements identified through integration can be mapped to genes in key pathways. The diagram below models a generalized pathway enrichment workflow.
From Constrained Element to Pathway
The Scientist's Toolkit: Research Reagent Solutions
Table 3: Essential Reagents & Resources for Validation Experiments
| Reagent/Resource | Function in Validation | Example Product/ID |
|---|---|---|
| Luciferase Reporter Vectors (pGL4-series) | Assay the enhancer/promoter activity of conserved non-coding sequences cloned upstream of a minimal promoter. | Promega pGL4.23[luc2/minP] |
| Genome Editing Nucleases (CRISPR-Cas9) | Knock out or modify the identified constrained element in cell lines to study downstream gene expression effects. | Integrated DNA Technologies Alt-R CRISPR-Cas9 system |
| Dual-Luciferase Reporter Assay System | Quantify firefly luciferase (experimental) and Renilla luciferase (control) activity from co-transfected constructs. | Promega Dual-Luciferase Reporter Assay Kit (E1910) |
| ChIP-Grade Antibodies | Validate predicted transcription factor binding within conserved elements by chromatin immunoprecipitation. | Cell Signaling Technology, Anti-H3K27ac (C15410196) |
| Induced Pluripotent Stem Cells (iPSCs) | Model disease-relevant cellular contexts (e.g., neuronal differentiation) for functional studies of prioritized variants. | WiCell Research Institute, disease-specific lines |
| Massively Parallel Reporter Assay (MPRA) Libraries | High-throughput screening of thousands of candidate sequences for regulatory activity. | Custom oligo library synthesis (Twist Bioscience) |
| UCSC Table Browser & liftOver | Extract coordinate data and convert between genome assemblies for data integration. | UCSC utilities (liftOver, bigBedToBed) |
Conclusion
The Zoonomia mammalian phylogeny is more than a tree; it is a transformative, sequence-based functional assay spanning 100 million years of evolution. For biomedical researchers, it provides an unparalleled filter to distinguish functional genomic signals from noise, dramatically improving the prioritization of disease-associated variants and non-coding elements. By synthesizing foundational knowledge, methodological applications, troubleshooting guidance, and comparative validation, this article underscores the project's pivotal role in translating evolutionary insight into mechanistic understanding. The future lies in integrating this phylogenetic framework with emerging multi-omic and phenotypic data, promising to accelerate the identification of novel therapeutic targets, refine disease models, and ultimately enable more precise and predictive biomedical science. The Zoonomia Project establishes a new standard for leveraging natural variation to understand human health and disease.