COG Database 2024: A Comprehensive Guide to Functional Categorization of Bacterial Genomes for Biomedical Research
This article provides a comprehensive overview of the COG (Clusters of Orthologous Genes) database, a pivotal resource for phylogenetic classification and functional annotation of prokaryotic proteins.
COG Database 2024: A Comprehensive Guide to Functional Categorization of Bacterial Genomes for Biomedical Research
Abstract
This article provides a comprehensive overview of the COG (Clusters of Orthologous Genes) database, a pivotal resource for phylogenetic classification and functional annotation of prokaryotic proteins. Targeting researchers, scientists, and drug development professionals, we explore the 2024 database update covering 2,296 bacterial and archaeal genomes and 4,981 COGs. The scope spans from foundational concepts and evolutionary history to practical methodologies for genome annotation, troubleshooting common analysis challenges, and validation through comparative genomics and experimental case studies. This guide synthesizes current capabilities with emerging applications in microbial genomics, pathogenesis research, and therapeutic discovery.
Understanding COGs: Evolutionary Foundations and Database Architecture
Clusters of Orthologous Genes (COGs) represent a systematic approach to classifying proteins from complete genomes based on orthologous relationships, serving as a fundamental resource for functional annotation and evolutionary studies in microbiology and genomics. Originally developed in 1997 and maintained by the National Center for Biotechnology Information (NCBI), the COG database provides a phylogenetic classification of proteins from sequenced genomes, enabling researchers to transfer functional information from characterized proteins to uncharacterized orthologs across species [1] [2] [3]. The core premise underlying the COG system is that orthologous proteins—direct evolutionary counterparts related by vertical descent from a common ancestor—typically retain the same fundamental function across different species, whereas paralogous proteins (related by gene duplication within a genome) often diverge functionally [2] [4] [3]. This conceptual framework makes COGs an invaluable tool for predicting protein functions in newly sequenced genomes and for conducting large-scale comparative genomic analyses.
The COG methodology has evolved significantly since its inception, with the most recent 2024 update expanding coverage to include 2,296 organisms (2,103 bacterial and 193 archaeal species) and 5,061 distinct COGs [1] [5]. A distinctive feature of the COG approach is its reliance on complete genome sequences, which enables more reliable identification of potential orthologs and paralogs compared to methods using incomplete genomic data [2]. The system utilizes flexible similarity cutoffs that accommodate proteins with dramatically different evolutionary rates, from barely detectable to extremely high sequence similarity, allowing COGs to reflect the natural evolutionary breadth of protein families without artificial constraints [2]. This flexibility is particularly valuable for classifying short proteins and distantly related orthologs that might be missed with strict BLAST cutoffs.
COG Construction and Classification Methodology
Core Construction Algorithm
The COG construction process employs a rigorous protocol that combines automated algorithms with manual curation to delineate orthologous groups. The methodology is built upon the fundamental concept that orthologs typically show reciprocal sequence similarity across genomes. The specific steps in COG construction include:
- Comprehensive sequence comparison: An all-against-all protein sequence comparison is performed using gapped BLAST, with low-complexity and predicted coiled-coil regions masked to improve accuracy [3].
- Paralog identification and grouping: Proteins from the same genome that are more similar to each other than to any proteins from other species are detected and collapsed into paralogous groups [3].
- Triangle of best hits detection: The system identifies triangles of mutually consistent genome-specific best hits (BeTs) across three phylogenetically distant genomes, applying the principle of transitivity in orthology relationships [2] [3].
- COG formation through triangle merging: Triangles with a common side are merged to form preliminary COGs, representing clusters of co-orthologous genes that accommodate one-to-one, one-to-many, and many-to-many orthologous relationships [3].
- Manual curation and domain analysis: Each preliminary COG undergoes case-by-case analysis to eliminate false positives and identify multidomain proteins. Detected multidomain proteins are split into single-domain segments, which are then reassigned to appropriate COGs according to their distinct evolutionary affinities [3].
- Refinement of large COGs: Large COGs containing multiple members from all or several genomes are examined using phylogenetic trees, cluster analysis, and visual inspection of alignments, with some groups being split into smaller, more evolutionarily coherent COGs [3].
This construction method requires that a minimal COG includes proteins from at least three distinct phylogenetic lineages, ensuring robust evolutionary classification [3]. For adding new proteins to existing COGs, the COGNITOR program utilizes the same principle of consistency between genome-specific best hits, requiring that a new protein produces at least two best hits into the same COG to be considered a candidate member [4] [3].
Visual Representation of COG Construction Workflow
The following diagram illustrates the systematic process of COG construction:
Table 1: COG Database Statistics (2024 Update)
| Parameter | Count | Description |
|---|---|---|
| Total COGs | 5,061 | Distinct clusters of orthologous genes |
| Organisms Covered | 2,296 | 2,103 bacterial and 193 archaeal species |
| Genomic Loci | 6,266,336 | Specific genomic positions represented |
| Protein IDs | 5,872,258 | Individual protein sequences classified |
| Taxonomic Categories | 42 | Distinct phylogenetic lineages represented |
| COG Symbols | 4,106 | Unique identifiers for protein families |
Source: NCBI COG Database Statistics [5]
Functional Annotation Using COGs
Annotation Workflow and Principles
COG functional annotation represents a powerful bioinformatics approach that leverages orthology and functional conservation to predict protein functions. The underlying principle is that genes sharing a common ancestor typically retain similar biological functions throughout evolution, with functional domains and key features being conserved [6]. The standard workflow for COG-based functional annotation involves four key stages:
- Data Preparation: Researchers collect query gene or protein sequences from the genome of interest and perform quality control to ensure sequence accuracy and integrity [6].
- Sequence Alignment and Homology Identification: Query sequences are compared against the COG database using alignment tools such as BLAST (Basic Local Alignment Search Tool). When a query sequence shows significant similarity to sequences within a specific COG group, it is considered homologous to that group [6] [2].
- Functional Assignment: Based on established homology, the query gene is assigned to a specific COG functional category. The COG system provides diverse functional categories covering various metabolic processes, cellular structures, and signaling pathways, enabling comprehensive functional classification [6].
- Data Analysis and Interpretation: Annotation results undergo statistical analysis to assess the distribution of functional categories across the genome, with findings interpreted in the context of experimental data and biological knowledge [6].
A key advantage of the COG approach for functional annotation is its reliance on evolutionary classification rather than simple best-hit annotation, which reduces errors associated with transitive annotation and domain architecture differences that often plague conventional database searches [2]. The system's manual curation component further enhances annotation accuracy by verifying relationships and ensuring conservation of functionally important features across orthologs [3].
Visualization of Functional Annotation Process
The following diagram illustrates the workflow for COG-based functional annotation:
Applications in Microbial Genomics and Drug Development
Genome Annotation and Comparative Genomics
COG analysis serves as a cornerstone in functional genome annotation, particularly for newly sequenced microbial genomes. By mapping unknown genes to established COG categories, researchers can generate initial functional hypotheses for a significant proportion of coding sequences in a genome [6] [2]. In comparative genomics, COGs enable systematic comparison of functional capabilities across multiple species, revealing conservation and divergence of metabolic pathways and cellular processes [2]. The phyletic patterns of COGs—representing their presence or absence across different taxa—provide insights into evolutionary relationships, lineage-specific gene loss, and horizontal gene transfer events [2] [3]. This application is particularly valuable for understanding the genomic basis of phenotypic differences between related microorganisms and for identifying core genes essential across specific phylogenetic groups.
Metabolic Pathway Analysis and Drug Target Identification
The COG database facilitates metabolic pathway elucidation by identifying key enzymes and functional modules within complex metabolic networks [6]. For drug development professionals, this capability enables systematic mapping of metabolic vulnerabilities in pathogenic microorganisms. Category Q (Secondary metabolites biosynthesis, transport and catabolism) exemplifies this application, containing COGs related to specialized metabolic pathways that often produce bioactive compounds with antimicrobial properties [7]. The identification of pathogen-specific COGs—those present in pathogenic strains but absent in non-pathogenic relatives or host organisms—provides promising targets for novel antimicrobial development. Additionally, COG-based essential gene prediction through phylogenetic profiling helps prioritize targets for drug discovery by identifying genes conserved across pathogens but absent in humans, potentially reducing host toxicity concerns.
Protocol: COG-Based Functional Annotation of Bacterial Genomes
Purpose: To annotate protein-coding genes from a newly sequenced bacterial genome using the COG database.
Materials and Bioinformatics Tools:
- High-quality assembled bacterial genome sequence
- Protein-coding gene predictions in FASTA format
- NCBI COG database (https://www.ncbi.nlm.nih.gov/research/cog/) [5]
- BLAST+ software suite (version 2.0 or higher)
- Computing infrastructure with adequate memory and storage
Procedure:
Data Preparation:
- Extract predicted protein sequences from the target genome.
- Format sequences in FASTA format and perform quality control to remove fragments and sequences with ambiguous residues.
Database Setup:
- Download the latest COG database from NCBI, including COG sequence files and associated metadata.
- Format the database for BLAST search using
makeblastdbcommand.
Sequence Comparison:
- Perform BLASTP search of query proteins against the COG database with an E-value threshold of 1e-5:
blastp -query your_sequences.fasta -db cog_db -out blast_results.xml -outfmt 5 -evalue 1e-5 -num_threads 8
- Perform BLASTP search of query proteins against the COG database with an E-value threshold of 1e-5:
COG Assignment:
- Parse BLAST results to identify significant hits (E-value < 1e-5, identity > 30%, coverage > 70%).
- Apply the COGNITOR principle: assign query proteins to COGs when they show at least two best hits to the same COG group.
- For proteins with hits to multiple COGs, examine domain architecture and perform manual curation to resolve ambiguities.
Functional Transfer:
- Transfer functional annotations from the best-matched orthologs in the COG database.
- Assign corresponding functional category codes (e.g., Q for Secondary metabolites) based on COG classification.
Validation and Quality Control:
- Verify conserved domain architectures using CDD or InterProScan.
- Cross-check annotations with other databases (UniProt, KEGG) for consistency.
- Manually review annotations for multidomain proteins and complex cases.
Troubleshooting:
- For low annotation rates, consider relaxing BLAST thresholds or using profile-based methods (RPS-BLAST) against COG position-specific scoring matrices [2].
- For ambiguous assignments, examine phylogenetic context and genomic neighborhood for additional evidence.
Research Reagent Solutions for COG-Based Studies
Table 2: Essential Research Reagents and Resources for COG Analysis
| Resource Type | Specific Tool/Database | Function in COG Analysis |
|---|---|---|
| Core Databases | NCBI COG Database [1] [5] | Primary resource for COG classifications, functional categories, and precomputed orthologous groups |
| RefSeq Complete Genomes [5] | Curated genome sequences essential for accurate orthology assignment and new COG construction | |
| Analysis Software | BLAST+ Suite [2] | Standard tool for sequence comparison and identification of homologous relationships |
| COGNITOR Program [4] [3] | Specialized tool for fitting new protein sequences into existing COG classifications | |
| Complementary Resources | EggNOG Database [2] | Extended orthology database with automated assignments for larger genome sets |
| CDD/InterPro [2] | Domain databases for verifying domain architecture conservation in orthologs | |
| Computational Infrastructure | High-performance Computing Cluster | Essential for all-against-all genome comparisons and large-scale phylogenetic analyses |
Advancements and Future Perspectives
The COG database has undergone significant evolution since its initial development, with the 2024 update incorporating numerous enhancements including expanded coverage of microbial diversity, improved annotations with references, and integration with PDB structures [1]. Recent developments have focused on increasing the coverage of proteins involved in specialized processes such as protein secretion pathways and expanding the repertoire of COGs for proteins with previously unknown functions [1] [5]. Future directions for COG research include addressing current limitations related to species coverage, particularly for understudied microbial lineages, and improving the annotation of fast-evolving or lineage-specific genes that remain challenging to classify [6] [2]. The integration of COG analysis with other 'omics' data types, including transcriptomics and proteomics, presents promising opportunities for systems-level understanding of microbial cellular processes. For drug development applications, ongoing efforts to enhance the resolution of COG classifications for target families such as transporters, receptors, and enzymes will further strengthen their utility in identifying and validating novel antimicrobial targets. As microbial genomics continues to expand with thousands of new genome sequences, the COG framework provides an essential foundation for organizing this wealth of information and extracting biologically meaningful insights for basic research and applied biotechnology.
The Clusters of Orthologous Genes (COG) database represents a cornerstone in the field of computational genomics, providing an essential framework for the functional and evolutionary classification of genes across microbial genomes. Originally created in 1997, the COG database has continuously evolved to accommodate the explosion of genomic data while refining its methodologies and expanding its scope [8] [3]. This framework has become indispensable for functional annotation of newly sequenced genomes, phylogenetic analysis, and identification of novel drug targets in pathogenic bacteria [3] [9]. The historical progression of COG reflects broader trends in microbial genomics, from the initial analysis of a handful of genomes to the current era of big data, where thousands of bacterial and archaeal genomes require systematic categorization [8] [10]. This article traces the COG database's development from its inception to its most recent 2024 update, focusing on its growing applications in functional categorization of bacterial genomes and its critical role in modern genomic research and drug discovery.
Historical Timeline and Quantitative Evolution
The COG database has undergone significant quantitative and qualitative changes since its establishment, marked by major updates that expanded both genomic coverage and functional annotations. The following table summarizes the key milestones in its evolution:
Table 1: Historical Evolution of the COG Database
| Year | Number of Genomes | Number of COGs | Key Developments and Innovations |
|---|---|---|---|
| 1997 | 7 genomes (5 bacteria, 1 archaea, 1 eukaryote) | 720 COGs | Initial development based on bidirectional best hits; focus on orthology detection [3] |
| 2000 | 21 complete genomes | 2,091 COGs | Introduction of COGNITOR program; expanded to include 56-83% of prokaryotic gene products [3] |
| 2003 | 66 unicellular organisms | 4,873 COGs | Major expansion including eukaryotes (KOGs); introduction of phyletic pattern search tool [10] [4] |
| 2014 | 753 genomes (630 bacteria, 123 archaea) | 4,872 COGs | Genus-level coverage; refined annotations; improved coverage of poorly characterized families [9] |
| 2021 | 1,309 species (1,187 bacteria, 122 archaea) | 4,877 COGs | Addition of CRISPR-Cas, sporulation, and photosynthesis COGs; pathway-based groupings [9] |
| 2024 | 2,296 species (2,103 bacteria, 193 archaea) | 4,981 COGs | Inclusion of bacterial secretion systems; updated taxonomy; enhanced RNA modification annotations [8] |
The most recent 2024 update represents the most significant expansion in recent years, with a 75% increase in genome coverage compared to the 2021 version [8]. This expansion strategically focuses on comprehensive genus-level representation, selecting a single representative genome per genus with exceptions for model organisms and important pathogens. The update also incorporated 64 genomes listed at the 'chromosome' level to improve coverage of poorly sampled lineages [8]. The distribution of COGs across genomes follows a characteristic pattern, with a small fraction of nearly universal COGs present in almost all genomes and the majority found in only a few genomes, reflecting the diverse evolutionary paths of prokaryotic lineages [8].
Methodological Evolution: From Basic Clustering to Advanced Annotation
Core COG Construction Methodology
The fundamental methodology for COG construction has remained consistent since its inception, based on the principle of identifying orthologous relationships through sequence similarity and evolutionary relationships. The original procedure involved several key steps that have been refined over time:
Comprehensive Sequence Comparison: Performing all-against-all protein sequence comparisons using gapped BLAST after masking low-complexity and predicted coiled-coil regions [3]
Paralog Detection and Grouping: Identifying and collapsing obvious paralogs within the same genome that are more similar to each other than to any proteins from other species [3]
Orthology Triangle Detection: Detecting triangles of mutually consistent, genome-specific best hits (BeTs) considering the paralogous groups identified in the previous step [3]
COG Formation: Merging triangles with a common side to form preliminary COGs [3]
Manual Curation and Validation: Case-by-case analysis of each COG to eliminate false positives and identify multidomain proteins, which are split into single-domain segments [3]
Refinement of Large COGs: Examination of large COGs containing multiple members using phylogenetic trees, cluster analysis, and visual inspection of alignments, with subsequent splitting into smaller, more accurate groups [3]
The COGNITOR program, introduced early in the database's development, remains crucial for adding new members to existing COGs based on the principle of consistency between genome-specific best hits [3] [10]. The current threshold for assigning proteins to COGs requires three best hits to minimize false assignments, with users having the option to increase stringency by requiring more hits [3].
Evolution of Taxonomic and Functional Annotation
The 2024 update introduced significant improvements in taxonomic classification and functional annotation. Taxonomically, the database adopted the new bacterial and archaeal phylum names mandated by the International Committee on Systematics of Prokaryotes, which added the suffix '-ota' to previously used names (e.g., Firmicutes became Bacillota) [8]. This update also improved coverage of previously underrepresented archaeal phyla such as Asgardarchaeota and bacterial phyla including Campylobacterota and Myxococcota [8].
Functionally, the 2024 release added approximately 100 new COGs, primarily focused on bacterial protein secretion systems, including types II through X, as well as Flp/Tad and type IV pili [8]. These additions enable straightforward identification of prokaryotic lineages that possess or lack particular secretion systems, with significant implications for understanding pathogenesis and developing antimicrobial strategies. The annotation improvements extended to rRNA and tRNA modification enzymes, multi-domain signal transduction proteins, and previously uncharacterized protein families [8]. The database now includes updated annotations for over 150 COGs, with 43 previously uncharacterized COGs (S-COGs) assigned to specific functional groups and 13 more assigned to the poorly characterized group (R-COGs) [8].
Table 2: Selected COGs with Updated Annotations in the 2024 Release
| COG Number | Previous Annotation | Updated Annotation | Functional Category |
|---|---|---|---|
| COG1649 | Uncharacterized lipoprotein YddW, UPF0748 family | Divisome-localized peptidoglycan glycosyl hydrolase DigH/YddW | Cell wall biogenesis |
| COG2324 | Uncharacterized membrane protein | Carotenoid 2′,3′-hydratase CruF | Metabolic processes |
| COG4683 | Uncharacterized conserved protein | Toxin component of RelE/ParE type II toxin-antitoxin system | Defense mechanisms |
| COG4924 | Uncharacterized conserved protein | Nuclease subunit JetD of Wadjet anti-plasmid defense system | Defense mechanisms |
| COG5352 | Uncharacterized conserved protein | Transcription factor GcrA interacting with sigma70 | Transcription |
Application Notes and Experimental Protocols
Protocol for Functional Annotation of Novel Bacterial Genomes Using COGs
Purpose: To assign putative functions to genes from newly sequenced bacterial genomes through orthology-based analysis using the COG database.
Materials and Reagents:
- High-quality annotated protein sequences from the target genome
- Access to the COG database (https://www.ncbi.nlm.nih.gov/research/COG/)
- Computational tools: BLAST+ suite, COGNITOR program
- Workstation with minimum 8GB RAM and multi-core processor for genomes >5,000 genes
Procedure:
Data Preparation:
- Obtain complete protein sequence file in FASTA format
- Ensure sequences are properly annotated with unique identifiers
- For large genomes (>5,000 genes), pre-filter sequences to remove obvious transposases and phage-related proteins
Sequence Comparison:
- Run BLASTP search against the COG database using an E-value cutoff of 0.001
- Use the following command-line parameters for optimal sensitivity:
-evalue 0.001 -max_target_seqs 50 -outfmt 6 - For divergent genomes (e.g., obligate parasites), consider using PSI-BLAST with 3 iterations
COG Assignment:
- Process BLAST results using the COGNITOR program with default parameters
- Apply the three-best-hit criterion for robust COG assignment
- Manually verify assignments for essential genes (e.g., ribosomal proteins, RNA polymerase subunits)
Functional Transfer:
- Assign putative functions based on experimentally characterized members of the COG
- Note any inconsistencies in domain architecture that might indicate erroneous assignment
- Flag multidomain proteins for additional analysis using CDD or InterProScan
Phyletic Pattern Analysis:
- Identify lineage-specific gene losses by comparing COG distribution across related taxa
- Use absence of universal single-copy COGs to assess genome completeness
- Identify potential horizontal gene transfer events through anomalous phyletic patterns
Troubleshooting:
- For low assignment rates (<60% of genes), try iterative searches with profile-based methods
- For ambiguous assignments in large paralogous families, construct phylogenetic trees for resolution
- Always verify essential metabolic pathways through pathway reconstruction tools like KEGG
Protocol for Identification of Novel Drug Targets in Bacterial Pathogens
Purpose: To utilize COG functional categorization and phyletic patterns to identify potential species-specific drug targets in pathogenic bacteria.
Materials and Reagents:
- COG database with phyletic pattern search capability
- Genomic data for target pathogen and related non-pathogenic species
- Essential gene data from model organisms (e.g., E. coli, B. subtilis)
- Host genome data (human or other relevant host)
Procedure:
Target Selection Criteria Definition:
- Define parameters for ideal drug target: essential for pathogen viability, absent in host, conserved across pathogen strains
- Establish similarity thresholds to exclude proteins with significant similarity to host proteins (E-value < 10^-10)
Comparative Genomic Analysis:
- Identify COGs present in the target pathogen but absent in the host using phyletic pattern search
- Further refine to COGs present in all clinical isolates of the pathogen but absent in commensal relatives
- Cross-reference with essential gene data from model bacteria
Functional Prioritization:
- Prioritize COGs involved in essential processes: cell wall biosynthesis, DNA replication, protein synthesis
- Favor enzymes over structural proteins for small molecule targeting
- Avoid proteins with extensive paralogs due to potential functional redundancy
Experimental Validation Design:
- Design essentiality tests using gene knockout or knockdown methods
- Plan structural studies for promising targets without existing structures
- Develop activity assays based on known functions of COG members
Validation:
- Confirm essentiality through genetic experiments
- Verify expression during infection conditions
- Assess conservation across diverse clinical isolates
- Determine structural feasibility for drug binding
Visualization of COG Workflows and Functional Relationships
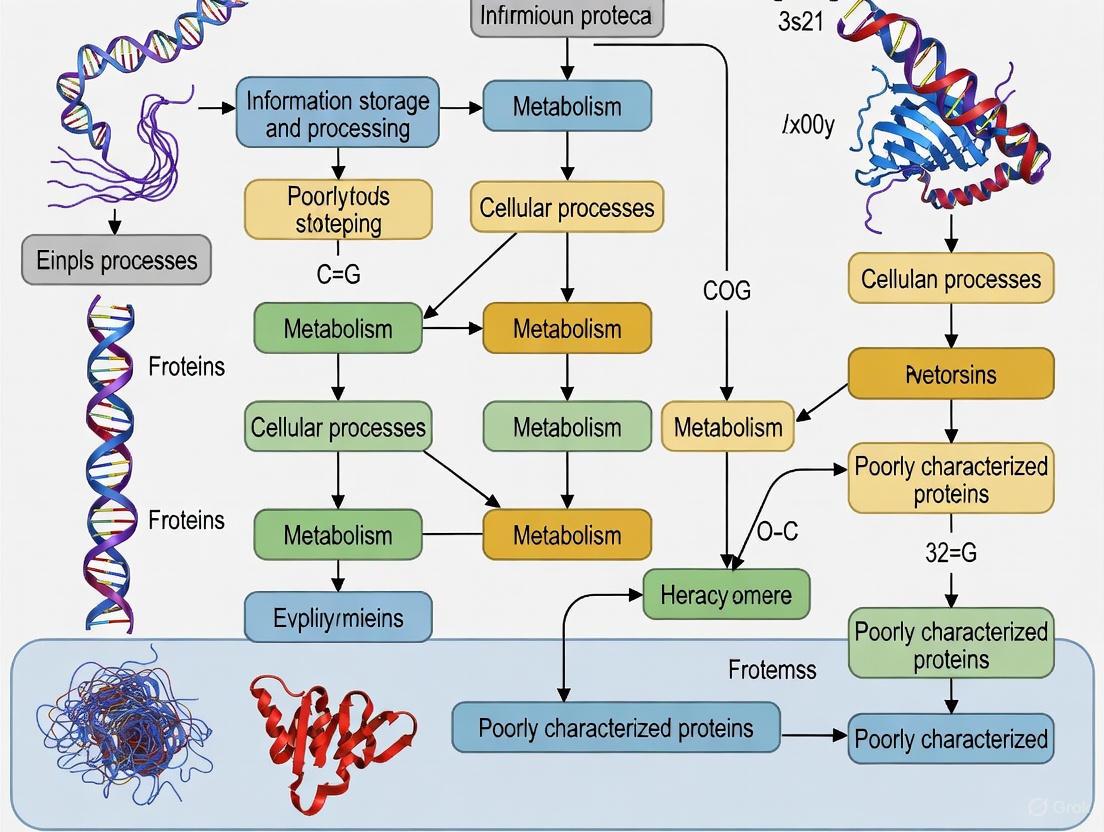
COG Construction and Analysis Workflow
Diagram 1: COG Construction Workflow. This diagram illustrates the key steps in constructing Clusters of Orthologous Genes, from initial sequence analysis through manual curation and final annotation.
COG-Based Functional Categorization System
Diagram 2: COG Functional Categorization and Applications. This diagram shows the major functional categories within the COG system and their primary research applications, highlighting the relationship between classification and practical use cases.
Table 3: Essential Research Reagents and Computational Tools for COG-Based Analyses
| Resource | Type | Function and Application | Access Information |
|---|---|---|---|
| COG Database | Database | Core resource containing clusters of orthologous genes with functional annotations | https://www.ncbi.nlm.nih.gov/research/COG/ [8] |
| COGNITOR | Software Program | Automated tool for fitting new protein sequences into existing COGs | Available through COG website [3] |
| BLAST+ Suite | Software Toolkit | Sequence similarity search tool essential for identifying orthologous relationships | https://blast.ncbi.nlm.nih.gov/ [3] |
| NCBI RefSeq | Database | Comprehensive, non-redundant sequence database used for COG genome selection | https://www.ncbi.nlm.nih.gov/refseq/ [8] |
| Phyletic Pattern Search | Analysis Tool | Identifies COGs with specific presence/absence patterns across taxa | Integrated in COG web interface [10] |
| CDD Database | Database | Conserved Domain Database used for annotation verification and domain analysis | https://www.ncbi.nlm.nih.gov/cdd/ [8] |
| Archaeal COGs (arCOGs) | Specialized Database | Archaea-specific orthologous groups for improved annotation of archaeal genomes | https://ftp.ncbi.nlm.nih.gov/pub/COG/ [9] |
The COG database has evolved from a specialized tool for analyzing a handful of genomes to an indispensable resource for the functional annotation and evolutionary analysis of thousands of microbial genomes. The historical trajectory from 1997 to 2024 demonstrates consistent expansion in scope and refinement in methodology, with the most recent update substantially improving coverage of bacterial diversity and annotation of secretion systems and RNA modification enzymes [8]. For researchers focused on bacterial pathogenesis and drug development, the COG framework provides a powerful approach for identifying potential therapeutic targets through comparative genomics and phyletic pattern analysis. The continued development of specialized COG collections for particular taxonomic groups and the ongoing refinement of functional annotations ensure that this resource will remain relevant as microbial genomics enters an era of increasingly complex and diverse datasets. Future directions likely include further expansion of archaeal COGs, splitting of paralog-rich COGs into finer-grained orthologous groups, and integration with other functional databases to provide increasingly accurate functional predictions for the rapidly growing universe of microbial genomic data.
The Clusters of Orthologous Genes (COG) database represents a foundational resource for the comparative genomic analysis of prokaryotes, providing a phylogenetic classification of proteins based on the concept of orthology. Originally created in 1997, the COG database has undergone multiple revisions to incorporate the expanding collection of sequenced genomes and refine its functional annotations [11] [3]. For researchers investigating bacterial physiology, evolution, and potential drug targets, the COG system offers a critical framework for transferring functional information from characterized proteins to novel gene products through identified orthologous relationships [3]. The 2024 update marks a significant expansion in genomic coverage and functional pathways, solidifying its utility in modern microbial genomics [11]. This application note details the updated scope, statistical coverage, and practical methodologies for employing the COG database in the functional categorization of bacterial genomes.
The 2024 update of the COG database substantially increases its genomic coverage from 1,309 to 2,296 prokaryotic species, encompassing 2,103 bacterial and 193 archaeal genomes [11] [5]. This collection strategically includes, in most cases, a single representative genome per genus, thereby maximizing phylogenetic diversity. The selected genomes cover all genera of bacteria and archaea listed with 'complete genomes' in NCBI databases as of November 2023 [11]. The protein family inventory has been expanded from 4,877 to 4,981 COGs, with a primary focus on incorporating families involved in bacterial protein secretion systems [11]. Consequently, the database now includes comprehensive pathways and functional groups for secretion systems of types II through X, as well as Flp/Tad and type IV pili [11]. These additions enable researchers to readily identify and examine prokaryotic lineages that possess or lack specific secretion machinery, a feature relevant for understanding pathogenesis and host-microbe interactions in drug development.
Key Statistics and Functional Categories
Table 1: COG Database Scope and Statistics (2024 Update)
| Metric | Detail | Source |
|---|---|---|
| Total Genomes | 2,296 | [11] [5] |
| Bacterial Genomes | 2,103 | [11] |
| Archaeal Genomes | 193 | [11] |
| Total COGs | 4,981 | [11] |
| Genomic Loci | 6,266,336 | [5] |
| Protein IDs | 5,872,258 | [5] |
Table 2: Representative COG Functional Categories and Additions in the 2024 Update
| Functional Category/Group | Description and Relevance | Update Notes |
|---|---|---|
| Protein Secretion Systems | Pathways for types II through X, Flp/Tad, and type IV pili. | Newly added functional groupings; crucial for understanding virulence and host interaction. [11] |
| RNA Modification Proteins | Proteins involved in rRNA and tRNA modification. | Improved annotations for better functional prediction. [11] |
| Signal Transduction | Multi-domain proteins involved in environmental sensing and response. | Enhanced annotation detail. [11] |
| Previously Uncharacterized Families | Protein families with previously unknown function. | New annotations for select families. [11] |
Experimental Protocols for COG-Based Functional Annotation
Leveraging the COG database for functional annotation involves a series of defined steps, from data preparation to functional interpretation. The following protocol describes a standard workflow for annotating a set of protein sequences, such as those derived from a newly sequenced prokaryotic genome.
Protocol: Functional Annotation of Protein Sequences Using the COG Database
1. Dataset Preparation: Begin with a set of protein sequences, typically predicted from a genome assembly. The dataset should be in FASTA format, with each entry containing a unique identifier [12].
2. COG Assignment via Sequence Similarity Search:
- Tool Selection: For large-scale datasets, the software DIAMOND is highly recommended. DIAMOND is a BLAST-compatible tool that can perform alignments up to 20,000 times faster than BLAST while maintaining consistent results, making it ideal for annotating thousands of genes efficiently [12].
- Execution Command:
This command specifies a sensitive alignment mode (
--more-sensitive), an E-value cutoff of 1e-5, and requests up to 20 target sequences per query [12]. - Alternative Approach: Some integrated annotation pipelines, such as anvi'o, provide dedicated workflows via the
anvi-run-ncbi-cogsprogram, which handles the setup and execution of the search against a local COG database [13].
3. Annotation Transfer: The alignment results are parsed to assign COG identifiers to the query proteins. This is typically achieved by identifying the best hits to proteins within the COG database that meet predefined score and E-value thresholds. The COGNITOR program, which is based on the principle of consistency of genome-specific best hits, is the historical method for this step [3]. A protein is assigned to a COG if it yields a sufficient number of best hits (BeTs) into that same COG, a method that helps minimize false assignments [3].
4. Functional and Categorical Interpretation: Once COG assignments are made, the corresponding functional annotations and categorical classifications (e.g., 'Amino acid transport and metabolism') are transferred to the query proteins from the COG database. This data can then be used for downstream statistical analyses, such as determining the distribution of genes across various functional categories.
The following workflow diagram illustrates the key steps in this annotation process:
Table 3: Key Research Reagent Solutions for COG Annotation
| Item/Resource | Function and Description | Application Notes |
|---|---|---|
| COG Database | A curated resource of Clusters of Orthologous Genes used as a reference for functional annotation. | The 2024 version is available from the NCBI website and FTP site. [11] [5] |
| DIAMOND Software | An ultra-fast, BLAST-compatible sequence aligner for matching protein sequences against the COG database. | Essential for efficient annotation of large metagenomic or genomic datasets. [12] |
| BLAST Suite | The standard suite of programs (e.g., blastp) for sequence similarity searching. | A well-established alternative to DIAMOND for smaller datasets. [3] |
| anvi'o Platform | An integrated analysis and visualization platform for omics data. | Provides the anvi-run-ncbi-cogs program for a streamlined COG annotation workflow. [13] |
| BASys2 | A next-generation bacterial genome annotation system. | One of many comprehensive pipelines that can utilize COG data among other resources for in-depth annotation. [14] |
Discussion and Concluding Remarks
The 2024 update of the COG database, with its systematic coverage of 2,296 prokaryotic genomes, provides an indispensable tool for functional genomics. Its expansion to include key systems like specialized secretion pathways directly supports research into microbial mechanisms relevant to drug discovery, such as virulence and resistance [11]. The consistent, orthology-based framework of COGs allows for reliable transfer of functional annotations and enables robust comparative analyses across diverse taxonomic lineages [3].
When performing COG functional annotation analysis, it is critical to move beyond simply reporting the most abundant categories. A high-quality analysis should identify key biological functions critical to the organism's biology, compare the COG distribution with other species to discuss evolutionary and functional similarities or differences, and acknowledge methodological limitations [15]. These limitations include the database's inherent scope, which, despite the update, does not cover all prokaryotic diversity, and the fact that not all proteins in a genome will find a match in the COG database, leaving a portion of any genome unannotated by this system [15] [3].
In conclusion, the COG database remains a cornerstone for the functional categorization of bacterial and archaeal genomes. Its continued curation and expansion ensure it will remain a vital resource for researchers and drug development professionals seeking to decipher the functional potential encoded in prokaryotic DNA.
The Clusters of Orthologous Genes (COG) database represents a foundational framework for the phylogenetic classification of proteins from completely sequenced genomes. Established in 1997 and maintained by the National Center for Biotechnology Information (NCBI), the COG system provides a robust platform for functional annotation and evolutionary studies of bacterial, archaeal, and eukaryotic genes [5] [9]. The core principle underlying the COG database is the identification of orthologous relationships—genes in different species that evolved from a common ancestral gene through vertical descent, which typically retain the same function over evolutionary time [3]. This orthology-based approach enables reliable transfer of functional information from experimentally characterized proteins in model organisms to uncharacterized proteins in newly sequenced genomes, making it an indispensable tool for genomic annotation and comparative analysis.
The functional classification system within COG organizes proteins into hierarchically structured categories that reflect their cellular roles and participation in biological pathways. This systematic categorization allows researchers to quickly assess the functional capabilities of an organism, identify missing metabolic components, and predict the biological pathways operating within a given genome. The most recent 2024 update of the COG database has substantially expanded its coverage to include 2,296 species (2,103 bacteria and 193 archaea), organized into 4,981 COGs that are further classified into functional pathways and systems [8]. This comprehensive coverage, typically with a single representative genome per genus, provides researchers with an unparalleled resource for exploring functional genomics across microbial diversity.
The 17 Broad Functional Categories
The COG database classifies proteins into 17 broad functional categories that encompass the major cellular functions and systems found across bacterial and archaeal lineages [16] [3]. This classification system enables researchers to quickly assess the functional composition of genomes and perform comparative analyses across taxonomic groups. The categories range from core informational processing functions to metabolic, cellular processing, and poorly characterized activities, providing a holistic view of an organism's functional capabilities.
Table 1: The 17 Broad Functional Categories in the COG Database
| Category Code | Functional Category | Representative Functions | Key Features |
|---|---|---|---|
| J | Translation | Aminoacyl-tRNA synthetases, ribosomal proteins, translation factors | Includes core components of the translation machinery |
| K | Transcription | RNA polymerase subunits, transcription factors | DNA-dependent transcription regulation |
| L | Replication, recombination and repair | DNA polymerase, helicases, nucleases | DNA replication, repair, and recombination systems |
| O | Post-translational modification, protein turnover, chaperones | Proteases, chaperones, protein modification enzymes | Protein folding, degradation, and modification |
| M | Cell wall/membrane/envelope biogenesis | Peptidoglycan synthesis, outer membrane proteins | Cell envelope structure and function |
| N | Cell motility and secretion | Flagellar proteins, secretion system components | Bacterial movement and protein secretion |
| T | Signal transduction mechanisms | Two-component systems, serine/threonine kinases | Cellular signaling and response pathways |
| U | Intracellular trafficking, secretion, and vesicular transport | Sec secretion system, vesicle transport | Protein transport across membranes |
| V | Defense mechanisms | Restriction-modification systems, toxin-antitoxin systems | Defense against phages and other threats |
| C | Energy production and conversion | ATP synthase, oxidoreductases, photosynthetic complexes | Energy metabolism and conversion |
| G | Carbohydrate transport and metabolism | Glycolytic enzymes, sugar transporters | Carbohydrate utilization and metabolism |
| E | Amino acid transport and metabolism | Amino acid biosynthesis enzymes, transporters | Amino acid metabolism and transport |
| F | Nucleotide transport and metabolism | Purine and pyrimidine biosynthesis enzymes | Nucleotide metabolism |
| H | Coenzyme transport and metabolism | Vitamin and cofactor biosynthesis enzymes | Coenzyme and vitamin metabolism |
| I | Lipid transport and metabolism | Fatty acid biosynthesis, phospholipid metabolism | Lipid metabolism |
| P | Inorganic ion transport and metabolism | Ion channels, transporters, metalloenzymes | Inorganic ion transport and metabolism |
| Q | Secondary metabolites biosynthesis, transport and catabolism | Antibiotic biosynthesis, polyketide synthases | Secondary metabolite production |
| R | General function prediction only | Conserved proteins with predicted but unconfirmed function | Predicted biochemical activity without specific functional assignment |
| S | Function unknown | Poorly conserved or uncharacterized proteins | No predictable function assigned |
The distribution of proteins across these categories reveals fundamental insights into microbial biology. Informational categories (J, K, L) dealing with transcription, translation, and replication tend to be highly conserved across phylogenetically diverse organisms and are often used to reconstruct deep evolutionary relationships [3]. In contrast, metabolic categories (C, E, F, G, H, I, P) frequently show patchier phylogenetic patterns reflecting adaptations to specific ecological niches and nutritional requirements [3]. The categories for cellular processes and signaling (M, N, O, T, U, V) often contain lineage-specific expansions that correlate with particular lifestyles or environmental adaptations.
A notable feature of the classification system is the explicit acknowledgment of limited functional knowledge through the R (General function prediction only) and S (Function unknown) categories [3] [8]. The persistence of these categories, even in the most recent database updates, highlights the significant gaps that remain in our understanding of microbial gene functions despite decades of genomic research. The 2024 COG update specifically addressed this knowledge gap by reclassifying 43 former S-COGs into specific functional categories and assigning 13 more to the R group based on recent experimental evidence and improved bioinformatic analyses [8].
COG Pathways and Functional Systems
Beyond the 17 broad categories, the COG database organizes related protein families into specific pathways and functional systems that represent coordinated biological processes [8] [17]. This pathway-level organization enables researchers to rapidly identify all components of a particular cellular system within a genome and assess its functional completeness. The pathway classification has been significantly expanded in recent updates, particularly for bacterial secretion systems and RNA modification enzymes, reflecting advances in our understanding of these complex cellular machines.
Table 2: Selected COG Pathways and Functional Systems
| Pathway/Functional System | Number of COGs | Biological Role | Taxonomic Distribution |
|---|---|---|---|
| CRISPR-Cas system | 46 | Adaptive immune system against mobile genetic elements | Widespread but patchy in bacteria and archaea |
| Sec pathway | 9 | General secretory pathway for protein translocation | Universal in bacteria and archaea |
| Type II secretion/Type IV pili | 27 | Protein secretion and pilus assembly | Mainly Gram-negative bacteria |
| Type VI secretion system | 25 | Contact-dependent toxin delivery into target cells | Predominantly Gram-negative bacteria |
| Aminoacyl-tRNA synthetases | 26 | Attachment of amino acids to their cognate tRNAs | Universal |
| Ribosome 30S subunit | 21 | Small ribosomal subunit proteins | Universal |
| Ribosome 50S subunit | 33 | Large ribosomal subunit proteins | Universal |
| RNA polymerase | 16 | DNA-dependent RNA transcription | Universal |
| FoF1-type ATP synthase | 12 | ATP synthesis coupled to proton gradient | Widespread |
| NADH dehydrogenase | 15 | Electron transport chain complex I | Widespread |
| Glycolysis | 18 | Glucose breakdown to pyruvate | Universal central pathway |
| TCA cycle | 16 | Aerobic respiration and carbon skeleton provision | Widespread in aerobic organisms |
| Purine biosynthesis | 20 | De novo purine nucleotide synthesis | Universal |
| Arginine biosynthesis | 12 | Arginine synthesis from glutamate | Variable, pathway completeness indicates metabolic capabilities |
| tRNA modification | 67 | Chemical modification of tRNA nucleotides | Universal, with variations |
| 16S rRNA modification | 16 | Ribosomal RNA modification | Universal |
| 23S rRNA modification | 12 | Ribosomal RNA modification | Universal |
| Photosystem II | 26 | Light-driven water oxidation in photosynthesis | Cyanobacteria and photosynthetic bacteria |
The pathway classification reveals several important biological insights. First, core informational pathways such as ribosome components, RNA polymerase, and aminoacyl-tRNA synthetases show remarkable conservation across the tree of life, with nearly universal distribution among bacterial and archaeal lineages [3]. Second, metabolic pathways display considerable variation that often correlates with an organism's habitat and ecological niche [17]. Third, specific adaptive systems such as secretion systems and CRISPR-Cas arrays show patchy distributions that likely reflect horizontal gene transfer events and specific evolutionary pressures [8].
The 2024 COG update placed special emphasis on bacterial secretion systems, adding over 100 new COGs primarily dedicated to these complex molecular machines [8]. The database now includes comprehensive coverage of secretion systems types II through X, as well as Flp/Tad and type IV pili. This expansion enables researchers to systematically examine the distribution of these systems across prokaryotic lineages and investigate their evolutionary relationships. Similarly, significant improvements were made to the annotation of tRNA and rRNA modification enzymes, with updated functional descriptions that reflect recent discoveries about their diverse roles in fine-tuning translation and regulating gene expression [8].
Experimental Protocols for COG Analysis
Protocol 1: Genome Annotation Using COGNITOR
The COGNITOR program is the primary tool for assigning proteins from newly sequenced genomes to existing COGs, enabling rapid functional annotation based on orthology [3]. The program operates on the principle of consistency of genome-specific best hits, requiring that a protein from a new genome shows significant similarity to multiple members of a particular COG.
Materials and Reagents:
- Protein sequences from the target genome in FASTA format
- COG database (current version available from NCBI FTP site)
- BLAST+ software suite for sequence comparison
- Computational resources capable of handling whole-genome analysis
Procedure:
- Retrieve the current COG database from the NCBI FTP site (https://ftp.ncbi.nlm.nih.gov/pub/COG/) [8]. The database includes protein sequences for all COG members, COG definitions, and functional annotations.
Perform all-against-all sequence comparison between the target proteome and the COG database using the gapped BLAST program. Mask low-complexity and predicted coiled-coil regions to avoid spurious matches [3].
Identify best hits from the target proteome to each genome in the COG database. The COGNITOR algorithm requires that a protein from the target genome shows significant similarity (E-value below a specified threshold, typically 0.001) to multiple proteins within the same COG.
Apply the consistency criterion: A protein is assigned to a COG if it produces at least three consistent best hits to members of that COG from different species [3]. This multi-genome requirement reduces false positive assignments.
Validate domain architecture: For proteins assigned to COGs, verify that the domain architecture is consistent with other COG members. Multidomain proteins may need to be split into individual domains, with each domain assigned to separate COGs [3].
Manual curation: Examine borderline cases manually by reviewing alignment quality, conservation of functional residues, and domain structure. This step is particularly important for COGs containing paralogs with distinct functions.
Troubleshooting:
- If a protein produces best hits to multiple COGs, it may represent a multidomain protein that needs to be split into individual domains.
- Proteins with weak similarity to a COG (E-value > 0.001) but meeting the best-hit criteria should be flagged for manual inspection.
- Proteins that cannot be assigned to any existing COG may represent novel protein families not yet captured in the database.
Protocol 2: Phylogenetic Pattern Analysis for Comparative Genomics
Phylogenetic patterns—the pattern of species presence or absence in each COG—provide powerful insights into gene gain and loss events, horizontal gene transfer, and lineage-specific adaptations [3]. Analyzing these patterns across multiple genomes can reveal core genes essential across taxa and accessory genes associated with specific phenotypes.
Materials and Reagents:
- COG database with phylogenetic pattern data
- Genome metadata (taxonomy, habitat, phenotype information)
- Statistical analysis software (R, Python with pandas)
- Visualization tools for displaying pattern distributions
Procedure:
- Extract phylogenetic patterns for COGs of interest from the database. Each pattern is represented as a binary string indicating presence (1) or absence (0) in each reference genome.
Identify core and accessory COGs: Calculate the fraction of genomes represented in each COG. COGs found in ≥90% of genomes are typically considered "core" genes, while those with patchier distributions represent "accessory" genes [8].
Correlate patterns with phenotypes: For COGs with patchy distributions, examine whether presence/absence correlates with specific biological characteristics (e.g., pathogenicity, metabolic capabilities, environmental adaptations). Statistical tests such as Fisher's exact test can identify significant associations.
Reconstruct gene gain and loss events: Using phylogenetic trees of the organisms, map COG presence/absence onto branches to infer evolutionary events. Tools like COUNT or GLOOME can automate this process.
Identify horizontally transferred genes: Look for COGs with distributions that conflict with the species phylogeny, particularly those restricted to a specific habitat rather than a taxonomic group.
Functional enrichment analysis: For sets of COGs with similar phylogenetic patterns, perform functional enrichment analysis to identify biological processes over-represented in the set.
Implementation Example: A study investigating acidophilic bacteria might identify COGs present in acidophiles but absent in neutralophiles. These COGs might include proton export systems, specialized membrane transporters, or DNA repair mechanisms adapted to acidic conditions. The phylogenetic pattern would reveal whether these adaptations were acquired vertically from a common acidophilic ancestor or horizontally transferred between diverse acidophiles.
Protocol 3: Pathway Completion Analysis
Pathway completion analysis assesses whether all components of a biological pathway are present in a genome, providing insights into an organism's metabolic capabilities and potential auxotrophies [17]. This approach is particularly valuable for predicting growth requirements and metabolic dependencies.
Materials and Reagents:
- Annotated genome with COG assignments
- COG pathway collections (available from https://www.ncbi.nlm.nih.gov/research/cog/pathways/)
- Reference pathway databases (KEGG, MetaCyc) for comparison
- Specialized software for pathway visualization and analysis
Procedure:
- Select pathways for analysis based on biological questions. For example, amino acid biosynthesis pathways for investigating auxotrophies, or secretion systems for studying host-pathogen interactions.
Retrieve COG members for each component of the pathway from the COG pathway database. For example, the arginine biosynthesis pathway includes 12 COGs representing different enzymatic steps [17].
Map COG assignments from the target genome onto the pathway components. Identify which pathway components are present and which are missing.
Assess pathway completeness: Determine whether the pathway appears complete, partially complete, or absent. Consider alternative enzymes or non-orthologous replacements that might fulfill the same function.
Evaluate functional implications: For incomplete pathways, predict metabolic capabilities or auxotrophies. For example, missing components in an amino acid biosynthesis pathway suggest that the organism requires that amino acid in its growth medium.
Compare across taxa: Analyze pathway conservation across related organisms to distinguish lineage-specific losses from general absences in larger taxonomic groups.
Case Study: Amino Acid Biosynthesis Analysis of the aromatic amino acid biosynthesis pathway (23 COGs) across bacterial genomes reveals distinct patterns of pathway completeness. While free-living organisms typically maintain complete pathways, intracellular pathogens and symbionts often show extensive pathway erosion, reflecting their reliance on host-derived nutrients [17]. This pattern is particularly evident in organisms with extremely reduced genomes such as Mycoplasma genitalium, which lacks multiple amino acid biosynthesis pathways [3].
Visualization of COG Classification and Analysis Workflow
The following diagrams illustrate key classification relationships and analytical workflows within the COG database system, providing visual guides to the organization and application of this functional classification framework.
Diagram 1: COG Database Construction and Classification Hierarchy. This workflow illustrates the process from genome collection through orthology detection to functional classification.
Diagram 2: COG-Based Analysis Workflow for New Genomes. This chart outlines the primary applications of the COG system for functional annotation and comparative genomics.
Table 3: Essential Research Reagents and Computational Resources for COG Analysis
| Resource Type | Specific Resource | Function/Purpose | Access Information |
|---|---|---|---|
| Database | COG Database | Central repository of Clusters of Orthologous Genes | https://www.ncbi.nlm.nih.gov/research/COG [5] |
| Software Tool | COGNITOR Program | Assigns new proteins to existing COGs | Included in COG database distribution [3] |
| Sequence Search | BLAST+ Suite | Protein sequence comparison and best-hit identification | https://blast.ncbi.nlm.nih.gov [3] |
| Data Access | NCBI FTP Site | Download current and archived COG data | https://ftp.ncbi.nlm.nih.gov/pub/COG/ [8] |
| Reference Data | RefSeq Database | Source of annotated protein sequences | https://www.ncbi.nlm.nih.gov/refseq/ [8] |
| Pathway Resources | COG Pathway Collections | Curated sets of COGs involved in specific pathways | https://www.ncbi.nlm.nih.gov/research/cog/pathways/ [17] |
| Taxonomy Reference | NCBI Taxonomy Database | Standardized taxonomic classification | https://www.ncbi.nlm.nih.gov/taxonomy [8] |
| Functional Reference | UniProt Database | Detailed protein functional information | https://www.uniprot.org/ [8] |
| Structural Reference | Protein Data Bank (PDB) | Protein structure information for COG members | https://www.rcsb.org/ [8] |
| Specialized Collections | arCOGs (Archaeal COGs) | Archaea-specific orthologous groups | https://ngdc.cncb.ac.cn/databasecommons/ [9] |
The COG database and its associated tools continue to evolve to meet the challenges of analyzing increasingly large genomic datasets. The 2024 update implemented several technical improvements, including the replacement of deprecated NCBI gene index (gi) numbers with stable RefSeq or GenBank/ENA/DDBJ coding sequence (CDS) accession numbers, ensuring long-term stability of protein identifiers [8]. Additionally, the database now provides comprehensive annotations with literature references and PDB links where available, enabling researchers to access detailed functional and structural information for COG members.
For researchers working with specific taxonomic groups, specialized COG collections such as arCOGs (Archaeal Clusters of Orthologous Genes) provide enhanced coverage and curation for particular lineages [9]. These specialized resources often include more detailed functional annotations and phylogenetic analyses tailored to the biological characteristics of the target organisms. The parallel development of these specialized collections alongside the comprehensive COG database ensures that researchers have access to appropriate tools regardless of their taxonomic focus.
The Clusters of Orthologous Genes (COG) database, an essential resource for the functional categorization of bacterial and archaeal genomes, has undergone a substantial expansion in its 2024 update. This release significantly broadens the database's phylogenetic scope and functional coverage, with dedicated efforts to incorporate protein families involved in bacterial secretion systems and to refine annotations for various protein families [11]. For researchers in microbial genomics and drug development, these developments provide enhanced capabilities for identifying potential therapeutic targets, such as virulence-associated secretion systems, and for generating more accurate functional predictions across diverse prokaryotic lineages. This Application Note details the novel features and provides protocols to leverage the updated COG resource effectively.
The 2024 update of the COG database represents a major scale-up in genomic coverage and functional content. The quantitative developments are summarized in the table below.
Table 1: Key Quantitative Changes in the COG 2024 Database Update
| Parameter | Previous Version | 2024 Update | Change | Significance |
|---|---|---|---|---|
| Genome Coverage | 1,309 species | 2,296 species (2,103 bacteria, 193 archaea) [11] | +987 species (+75%) | Broader phylogenetic representation; one genome per genus as a representative. |
| Total COGs | 4,877 | 4,981 [11] | +104 COGs | Incorporation of new protein families, primarily secretion systems. |
| New Functional Groups | Not Available | Secretion systems (Types II-X, Flp/Tad, Type IV pili) [11] | New | Enables systematic study of lineages possessing or lacking specific secretion systems. |
| Annotation Improvements | Previous baseline | rRNA/tRNA modification proteins, multi-domain signal transduction proteins, uncharacterized families [11] | Enhanced | More reliable functional predictions for these protein classes. |
The expansion to 2,296 genomes ensures that all bacterial and archaeal genera with 'complete genomes' in the NCBI databases as of November 2023 are represented, providing a comprehensive phylogenetic landscape for comparative analysis [11]. The addition of 104 new COGs is largely attributed to the systematic inclusion of protein families constituting key bacterial secretion systems. This allows researchers to straightforwardly identify and examine prokaryotic lineages that encompass—or lack—a particular secretion system, a critical feature for studying bacterial pathogenesis and intercellular communication [11].
Experimental Protocol: Profiling Secretion Systems in a Novel Genome
This protocol describes a standard methodology for using the updated COG database to identify and characterize secretion system genes in a newly sequenced bacterial genome.
Materials and Research Reagent Solutions
Table 2: Essential Research Reagents and Tools for COG Analysis
| Item Name | Function/Description | Example/Source |
|---|---|---|
| Protein Sequence File | Input data for functional annotation. | A FASTA file (.faa) of the predicted protein sequences from your genome of interest. |
| COG Database | Reference database of Clusters of Orthologous Groups. | Downloaded from the NCBI FTP site: https://ftp.ncbi.nlm.nih.gov/pub/COG/ [11]. |
| Sequence Comparison Tool | Software for aligning query sequences against the COG database. | BLAST+ suite (blastp) or DIAMOND (diamond blastp for accelerated searching) [18]. |
| COGNITOR or Similar Algorithm | Program to assign proteins to COGs based on the consistency of genome-specific best hits. | The method is embedded in the COG database resources and website [3]. |
| Annotation Scripts (Python/R) | Custom scripts for parsing results and generating summary statistics and visualizations. | -- |
Step-by-Step Procedure
Data Preparation:
- Obtain the complete set of predicted protein sequences from your target genome in FASTA format (
genome_proteins.faa). - Download the latest COG database files, including the multiple sequence alignments and functional annotations, from the official NCBI resource (
https://ftp.ncbi.nlm.nih.gov/pub/COG/[11]).
- Obtain the complete set of predicted protein sequences from your target genome in FASTA format (
Sequence Comparison:
- Use
diamond blastporblastpto compare your query proteins against the COG protein sequence database. - Example DIAMOND command:
- The
--more-sensitiveflag is recommended for improved accuracy, as noted in studies on protein sequence comparison benchmarks [18].
- Use
COG Assignment with COGNITOR Logic:
- The core principle of COG assignment involves identifying consistent, genome-specific best hits (BeTs). A protein is assigned to a COG if it has a minimum of two or three best hits to different proteins within that same COG [3].
- This process can be performed via the online COG resource at
https://www.ncbi.nlm.nih.gov/research/COG[11], which automates the COGNITOR logic, or by implementing the algorithm locally.
Analysis of Secretion System COGs:
- From the full set of COG assignments for your genome, filter the results to focus on the newly added secretion system COGs (Types II through X, Flp/Tad, and Type IV pili) [11].
- Construct a presence-absence matrix for these systems across your genomes of interest to identify potential virulence factors or unique adaptations.
Data Interpretation and Visualization:
- Generate a bar plot or a heatmap to visualize the distribution of different secretion system types across compared genomes.
- Functionally categorize the identified COGs and create a pie chart to represent the functional landscape of your genome, highlighting the prevalence of secretion systems.
The following workflow diagram illustrates the key steps of this protocol:
Accessing and Utilizing the Enhanced Annotations
Beyond the new secretion system COGs, the 2024 update provides improved annotations for several protein families critical for understanding fundamental cellular processes.
- rRNA and tRNA Modification Proteins: Refined annotations allow for more precise mapping of the cellular machinery that modifies RNA, which is crucial for proper protein synthesis and can be a target for antibacterial drugs [11].
- Multi-domain Signal Transduction Proteins: Enhanced classification of these complex proteins, often involving multiple domains like kinases and response regulators, improves the understanding of bacterial signal transduction networks [11].
- Previously Uncharacterized Families: A number of protein families that lacked clear functional predictions have now been characterized, reducing the "unknowns" in genome annotation and opening new avenues for research [11].
To access these annotations, researchers can use the online portal to browse specific COGs or download the complete annotation files. The integration of these improved annotations into automated analysis pipelines will significantly increase the accuracy of functional genomic studies. The following diagram outlines the logical relationship between different levels of functional analysis enabled by the updated COG database.
The 2024 update of the COG database marks a significant advancement, providing researchers with a more powerful and precise tool for the functional categorization of prokaryotic genomes. The strategic expansion to include secretion systems and improve annotations directly empowers studies in bacterial pathogenesis, cellular communication, and metabolic potential. By following the detailed protocols and utilizing the resources outlined in this document, scientists and drug development professionals can systematically uncover the functional blueprint of bacterial genomes, accelerating the discovery of novel biological mechanisms and therapeutic targets. The updated COG database is available at the NCBI website and FTP site [11].
Practical Implementation: COG Analysis workflows for Genome Annotation and Functional Prediction
The Database of Clusters of Orthologous Genes (COGs) is an established resource for the functional annotation of proteins from completely sequenced bacterial and archaeal genomes based on evolutionary relationships [8] [3]. Originally created in 1997, the COG database classifies proteins into orthologous groups, which are lineages of genes that diverged after a speciation event and typically retain the same function across different species [3]. This classification provides a robust framework for transferring functional information from characterized proteins to uncharacterized orthologs in newly sequenced genomes, making it an indispensable tool for comparative genomic analysis. The most recent 2024 update includes proteins from 2,296 species (2,103 bacteria and 193 archaea), substantially expanding its coverage to represent all bacterial and archaeal genera with completely sequenced genomes available in RefSeq as of November 2023 [8].
For researchers investigating bacterial genome evolution, pathogenesis, or metabolic pathways, the COG system offers several unique advantages. The database construction relies on the identification of consistent patterns of sequence similarity across multiple genomes, which helps in distinguishing orthologs from paralogs—a critical distinction for accurate functional prediction [3]. The COGs also provide a phylogenetic profile for each group, showing the pattern of species presence or absence, which can reveal important evolutionary events such as horizontal gene transfer or lineage-specific gene loss [19] [3]. These features make the COG database particularly valuable for studies aimed at understanding functional conservation and diversification across microbial taxa, as demonstrated in recent applications ranging from rhizosphere microbiome analysis [20] to studies of genomic islands and horizontal gene transfer [19].
Database Access Methods
NCBI Web Portal
The primary web interface for the COG database is maintained by the National Center for Biotechnology Information (NCBI) at https://www.ncbi.nlm.nih.gov/research/cog/ [5]. This portal provides user-friendly search capabilities and multiple entry points for accessing COG information, making it the recommended starting point for most research applications.
The search functionality supports several query types, which are summarized in the table below:
Table 1: COG Search Options Available via the NCBI Web Portal
| Search Type | Example Query | Use Case |
|---|---|---|
| COG Identifier | COG0002 or 105 |
Direct access to specific COG entries |
| Protein Name | polymerase |
Finding COGs related to specific proteins |
| Taxonomic Category | Mollicutes |
Exploring COG distribution in taxonomic groups |
| Organism Name | Aciduliprofundum_boonei_T469 |
Finding COGs in specific organisms |
| Metabolic Pathway | Arginine biosynthesis |
Identifying COGs associated with specific pathways |
| Assembly Accession | GCA_000091165.1 |
Linking COGs to specific genome assemblies |
| Protein Identifier | prot:WP_011012300.1 |
Finding COG membership of specific proteins |
A search for COG0002 on the portal returns detailed information about the N-acetyl-gamma-glutamylphosphate reductase (ArgC) involved in arginine biosynthesis, including statistics showing its presence in 1,863 genes across 1,867 organisms, a representative PDB structure (3DR3), and taxonomic distribution across archaeal and bacterial lineages [21]. The interface also provides direct links to download COG data and access related protein structures and sequences.
FTP Site Structure and Navigation
For bulk downloading or programmatic access, the COG database is available through the NCBI FTP site at https://ftp.ncbi.nlm.nih.gov/pub/COG/ [8]. This repository contains both the current release (COG2024) and archived previous versions, providing comprehensive data for large-scale analyses or comparative studies across different database versions.
The FTP site organization follows a logical structure, with key directories and files including:
- COG2024/: Directory containing the most recent database release
- data/: Subdirectory with core data files
- cog-24.org.tab: File listing all organisms included in the current release
- Archived releases/: Folder containing previous versions for historical comparison
Additionally, the broader NCBI Genomes FTP site (https://ftp.ncbi.nlm.nih.gov/genomes/) provides complementary annotation files for individual genomes, which can be correlated with COG classifications [22]. These include protein FASTA files (*_protein.faa.gz), gene ontology annotations (*_gene_ontology.gaf.gz), and feature tables (*_feature_table.txt.gz) that offer detailed information about genes and their products.
Selecting the Appropriate Access Method
The choice between web portal and FTP access depends on the specific research requirements:
- Web Portal: Ideal for targeted queries, exploratory analysis, and visualization of individual COG characteristics, taxonomic distribution, and functional annotations.
- FTP Site: Better suited for large-scale data mining, comparative genomics projects, integration with local bioinformatics pipelines, and accessing complete database snapshots.
For most research scenarios involving the functional categorization of bacterial genomes, a combined approach is recommended: using the web interface for initial exploration and validation, followed by FTP downloads for comprehensive analysis.
Experimental Protocols
Protocol 1: COG-Based Functional Annotation of Bacterial Genomes
This protocol describes a standard workflow for annotating protein sequences from bacterial genomes using the COG database, enabling functional categorization and comparative analysis.
Materials and Reagents
Table 2: Essential Research Reagents and Computational Tools
| Item | Function/Application |
|---|---|
| COG Database | Provides reference set of orthologous groups for classification [8] |
| COGNITOR Program | Algorithm for fitting new proteins into existing COGs [3] |
| BLAST Suite | Performs sequence similarity searches against COG members [3] |
| Protein Sequence Dataset | Query sequences from target bacterial genome(s) |
| Perl/Python Scripts | For parsing results and automating analysis steps |
Procedure
Data Acquisition
- Download the complete set of COG protein sequences and group definitions from the NCBI FTP site (COG2024 release) [8].
- Retrieve protein sequences from the target bacterial genome(s) in FASTA format, either from NCBI Genomes FTP or your own sequencing data.
Sequence Comparison
- Perform an all-against-all sequence comparison between query proteins and COG reference sequences using BLASTP with an E-value cutoff of 0.001 [3].
- For large datasets, consider using accelerated alternatives such as DIAMOND or USEARCH while maintaining comparable sensitivity.
Orthology Assignment
- Identify genome-specific best hits (BeTs) for each query protein against the COG database.
- Apply the COGNITOR algorithm, which assigns a protein to a COG if it has consistent best hits to multiple members of that COG [3]. The current standard requires at least three consistent best hits to minimize false assignments.
Functional Transfer
- Assign the functional annotation of the COG to the query protein, noting that this transfer is most reliable for simple COGs without paralogs [3].
- For COGs containing paralogs, exercise caution and consider additional evidence such as domain architecture or phylogenetic analysis before making specific functional predictions.
Validation and Quality Control
- Verify that multidomain proteins are correctly classified; consider splitting sequences into domains and repeating the analysis if necessary [3].
- Check the phylogenetic pattern of the assigned COG to ensure it is consistent with the evolutionary history of the organism.
Protocol 2: Identification of Pathway-Specific COG Enrichment
This protocol enables researchers to identify COGs that are significantly enriched in specific metabolic pathways, which is particularly useful for understanding the genetic basis of specialized metabolic capabilities across bacterial taxa.
Materials and Reagents
- COG Database with functional categories and pathway annotations [8]
- KEGG or MetaCyc Pathway Database for reference pathway definitions
- Statistical Computing Environment (R or Python with pandas, scipy)
- Genome Annotation Files for target organisms
Procedure
Pathway Definition
Genome Selection
- Identify bacterial genomes of interest using the NCBI assembly database [22].
- Download COG annotations for these genomes from the NCBI FTP site or generate them using Protocol 1.
Enrichment Analysis
- Create a binary matrix indicating presence/absence of each COG in each genome.
- For the pathway of interest, calculate the frequency of each associated COG across the genome set.
- Compare these frequencies to the background distribution of all COGs using statistical tests such as Fisher's exact test or chi-square test.
Interpretation
- Identify COGs that are significantly enriched (p < 0.05 with multiple testing correction) in the target pathway.
- Consider the phylogenetic distribution of enriched COGs to identify potential horizontal gene transfer events or lineage-specific adaptations [19].
Table 3: Example Results from COG Enrichment Analysis of Arginine Biosynthesis
| COG ID | COG Name | Frequency in Pathway | Background Frequency | p-value | Function |
|---|---|---|---|---|---|
| COG0002 | ArgC | 85% | 2% | <0.001 | N-acetyl-gamma-glutamylphosphate reductase [21] |
| COG0116 | ArgG | 82% | 3% | <0.001 | Argininosuccinate synthase |
The Scientist's Toolkit
Table 4: Essential Resources for COG-Based Genomic Analysis
| Resource | Description | Access Method |
|---|---|---|
| COG Web Interface | Primary search and visualization portal | https://www.ncbi.nlm.nih.gov/research/cog/ [5] |
| COG FTP Site | Bulk data download and archival versions | https://ftp.ncbi.nlm.nih.gov/pub/COG/ [8] |
| NCBI Genomes FTP | Genome sequences and annotations | https://ftp.ncbi.nlm.nih.gov/genomes/ [22] |
| COGNITOR | Algorithm for fitting new proteins into COGs | Implemented in web interface [3] |
| BLAST Suite | Sequence similarity search tool | https://blast.ncbi.nlm.nih.gov/ |
| Gene Ontology Annotations | Functional annotations for eukaryotic genomes | http://geneontology.org/docs/downloads/ [23] |
Data Analysis and Interpretation
Quantitative Analysis of COG Distribution
The current COG database (2024 release) contains 4,981 COGs distributed across 2,296 representative organisms, with a total of over 5.8 million protein sequences classified [5] [8]. The distribution of COGs follows a characteristic pattern where most COGs are present in only a few genomes, while a small fraction of "universal" COGs are found in almost all genomes [8]. This distribution reflects both functional conservation and the dynamic nature of microbial genome evolution through gene loss, duplication, and horizontal transfer.
Table 5: COG Database Statistics (2024 Release)
| Parameter | Value | Notes |
|---|---|---|
| Total COGs | 4,981 | Increased from 4,877 in previous version [8] |
| Covered Organisms | 2,296 | 2,103 bacteria + 193 archaea [8] |
| Protein Sequences | ~5.8 million | Classified into COGs [5] |
| New COGs in 2024 | ~100 | Primarily secretion systems and uncharacterized proteins [8] |
| Genome Representation | 56-83% | Percentage of proteins in each genome included in COGs [3] |
Functional Categorization Framework
COGs are classified into functional categories that facilitate the biological interpretation of genomic data. While the specific categorization has evolved since the early versions of the database, the original framework included 17 functional categories covering major cellular processes [3]. The database continues to include a significant number of poorly characterized (R category) and uncharacterized (S category) COGs, highlighting gaps in our knowledge of microbial protein functions that represent opportunities for future research [8].
In practice, COG functional categories can be used to generate functional profiles of bacterial genomes, enabling comparisons across taxa or ecological niches. For example, the analysis of genomic islands frequently reveals enrichment of specific COG categories related to adaptation functions [19], while studies of rhizosphere microbiomes can identify COGs involved in energy production and ATP hydrolysis [20].
Troubleshooting Common Issues
Researchers working with the COG database may encounter several common challenges:
- Paralog Distinction: COGs containing paralogs require careful interpretation, as not all members may share identical functions. Supplementary phylogenetic analysis is recommended for these cases [3].
- Taxonomic Coverage Limitations: While comprehensive, the COG database does not include all sequenced microbial genomes. Researchers working with poorly represented taxa may need to use complementary resources such as eggNOG [8].
- Domain Architecture Complexity: Multidomain proteins may be incorrectly assigned to COGs. The database addresses this by splitting such proteins into domains, but manual verification is still advisable [3].
- Function Transfer Validation: Functional predictions based on COG membership should be treated as hypotheses requiring additional validation, particularly for poorly characterized COGs.
The COG database remains a fundamental resource for functional genomics nearly three decades after its initial development. The dual access pathways through the NCBI web portal and FTP site provide flexibility for both interactive exploration and large-scale computational analysis. The recent 2024 update significantly expanded taxonomic coverage and added new COGs related to protein secretion systems, ensuring the database's continued relevance for contemporary microbial genomics research [8].
For researchers focused on bacterial genome annotation and comparative analysis, the COG framework offers a phylogenetically-aware approach to functional prediction that complements other resources such as KEGG and Gene Ontology. The protocols outlined in this document provide practical guidance for leveraging COG resources effectively, while the troubleshooting guidance helps address common analytical challenges. As microbial genomics continues to expand with new sequencing technologies, the COG database's curated approach to orthology determination will remain essential for meaningful biological interpretation of genomic data.
The Clusters of Orthologous Genes (COG) database is an indispensable tool for microbial genome annotation and comparative genomics, providing a phylogenetic classification of proteins from complete genomes. Originally created in 1997 and consistently updated, most recently in 2024, the database encompasses a robust collection of 5,061 COGs derived from 2,296 complete microbial genomes (2,103 bacteria and 193 archaea), covering 6,266,336 genomic loci and 5,872,258 protein IDs [5]. The core principle of the COG system is the grouping of proteins into families of orthologs and co-orthologs, which simplifies the assignment of general functions to genes and their products and provides a reliable framework for functional annotation [2]. This Application Note details the practical methodologies for interrogating the COG database using four primary search modalities: COG ID, Protein, Organism, and Pathway. These strategies are fundamental for researchers aiming to elucidate protein functions, perform comparative genomic analyses, identify potential drug targets, and predict functional systems across bacterial and archaeal lineages.
Table: COG Database Core Statistics (Updated 2025)
| Statistical Category | Count |
|---|---|
| Total COGs | 5,061 [5] |
| Genomic Loci | 6,266,336 [5] |
| Organisms | 2,296 [5] |
| Bacterial Species | 2,103 [11] |
| Archaeal Species | 193 [11] |
| Protein IDs | 5,872,258 [5] |
| Taxonomic Categories | 42 [5] |
Query by COG ID
Protocol and Application Notes
Querying by a specific COG identifier is the most direct method to retrieve information about a conserved protein family. This approach is optimal when a researcher begins with a known COG ID from literature or prior analysis and requires comprehensive details about its member proteins, distribution, and function.
Experimental Protocol:
- Access the COG Portal: Navigate to the official COG database at
https://www.ncbi.nlm.nih.gov/research/COG[5]. - Initiate COG ID Search: Locate the search interface and select the option to search by "COG Definition".
- Enter Query: Input the full COG identifier (e.g.,
COG0105) or just the numerical component (e.g.,105). The search system is designed to recognize both formats [5]. - Analyze Results Page: The result provides a detailed overview of the COG, including:
- Functional Annotation: A concise definition of the protein family's function (e.g., "Ribosomal protein L2").
- Phyletic Profile: A list of all genomes encoding a protein belonging to this COG, often presented as a binary (presence/absence) matrix across taxonomic groups [2].
- Member Proteins: A table of all protein accessions (e.g., RefSeq WP_011012300.1) clustered within the COG, with links to their respective entries in NCBI protein databases.
- Pathway Association: If applicable, information on the biochemical pathway the COG participates in is displayed.
- Available Structures: Links to experimentally determined protein structures in the PDB are provided where available [11].
Research Reagent Solutions
| Reagent / Resource | Function in Analysis |
|---|---|
| NCBI COG Website (https://www.ncbi.nlm.nih.gov/research/COG) | Primary web interface for executing COG ID queries and retrieving curated results. |
| COG Protein Accession Numbers (e.g., WP_011012300.1) | Unique identifiers for retrieving detailed protein sequence and metadata from NCBI databases. |
| PDB (Protein Data Bank) Links | Provide access to 3D structural data for functional and structural analysis of COG members. |
| FTP Archive (ftp.ncbi.nlm.nih.gov/pub/COG/) | Source for bulk download of entire COG datasets for offline or large-scale computational analysis [11]. ``` |
COG ID Search Workflow
Query by Protein
Protocol and Application Notes
This strategy is used to determine the COG affiliation and putative function of a specific protein sequence, which is a cornerstone of genome annotation pipelines. It answers the question, "To which orthologous group does my protein of interest belong?"
Experimental Protocol:
- Access the COG Portal: Navigate to the COG database website.
- Select Protein Search: Choose the search option for "Protein name".
- Enter Protein Identifier: Input a specific protein accession number from a major database (e.g.,
prot:WP_011012300.1) or a gene tag from an annotated genome (e.g.,gene_tag:Haur_1857) [5]. - Interpret Orthology Assignment: The result will identify the single COG to which the query protein is assigned. The underlying algorithm often uses RPS-BLAST to search the query sequence against a library of position-specific scoring matrices (PSSMs) generated from multiple sequence alignments of all COGs. The best-scoring hit assigns the protein to a COG [2].
- Leverage Annotation Transfer: The function of the query protein is inferred from the curated annotation of the COG to which it is assigned. This method of "orthology-based annotation" is generally more reliable than simple best-BLAST-hit annotation, as it leverages evolutionary relationships [2].
Research Reagent Solutions
| Reagent / Resource | Function in Analysis |
|---|---|
| RefSeq/GenBank Protein Accession | A stable identifier serving as the primary key for querying individual proteins. |
| RPS-BLAST Algorithm | The core search tool for comparing a query protein sequence against the PSSMs of COGs for accurate assignment. |
| COG PSSM (Position-Specific Scoring Matrix) Library | A curated collection of hidden Markov model-like profiles for each COG, used for sensitive sequence searches. |
| Gene Locus Tag (e.g., Haur_1857) | An organism-specific gene identifier that can be used to locate a protein and its COG assignment. ``` |
Protein to COG Assignment Workflow
Query by Organism
Protocol and Application Notes
Querying by a specific organism allows researchers to view the entire COG repertoire of a particular bacterium or archaeon. This is essential for comparative genomics, assessing the metabolic capabilities of an organism, and identifying lineage-specific gene losses or expansions.
Experimental Protocol:
- Access the COG Portal.
- Select Organism Search: Choose the search option for "Organism name".
- Enter Taxonomic Identifier: Input a full organism name (e.g.,
Aciduliprofundum_boonei_T469) or a broader taxonomic group (e.g.,Mollicutes) [5]. The database typically employs a single representative genome per genus to minimize redundancy [11]. - Analyze Genomic COG Profile: The output is a comprehensive list of all COGs present in the queried organism's genome. This profile can be:
- Mined for Metabolic Capacity: Used to reconstruct metabolic pathways based on the ensemble of enzymatic functions identified.
- Used for Comparative Analysis: Compared against the COG profiles of related organisms to identify unique absences or presences that may correlate with phenotypic differences.
- Screened for Drug Targets: Analyzed to identify conserved, essential COGs that are absent in the human host, which represent promising targets for novel antibiotics [2].
Table: Example COG Functional Categories in a Bacterial Genome
| COG Functional Category | Representative COG | Function | Count in Genome |
|---|---|---|---|
| Translation | COG0105 | Ribosomal protein L2 | Varies by Organism |
| Energy Production | COG0473 | 3-isopropylmalate dehydrogenase (LeuB) | Varies by Organism |
| Signal Transduction | COG2204 | Multi-domain signal transduction protein | Varies by Organism |
| Secretion | COG3201 | Type II secretion system protein | Varies by Organism |
| Function Unknown | COG9999 | Uncharacterized conserved protein | Varies by Organism |
Query by Pathway
Protocol and Application Notes
This high-level query strategy enables the systematic investigation of entire biological systems, such as biosynthesis or protein secretion machinery, across the microbial tree of life. The 2024 COG update specifically enhanced pathway annotations, particularly for bacterial secretion systems [11].
Experimental Protocol:
- Access the COG Portal.
- Select Pathway Search: Choose the search option for "Pathway".
- Enter Pathway of Interest: Input the name of a pathway or functional system (e.g.,
Arginine biosynthesis,Secretion system type II,CRISPR-Cas) [5] [11]. - Deconstruct Pathway into COGs: The system returns a predefined list of COGs that are known to work together to perform the function of the queried pathway. For example, querying "Type IV pili" will return a set of COGs representing the core structural and assembly components.
- Examine Phyletic Distribution: For each COG within the pathway, the user can examine its phyletic profile to determine which prokaryotic lineages possess (or lack) the complete system or specific components. This allows for straightforward evolutionary analysis of complex traits [11].
Research Reagent Solutions
| Reagent / Resource | Function in Analysis |
|---|---|
| Curated COG Pathway Lists | Pre-defined groupings of COGs that constitute a specific biological pathway or system. |
| Phyletic Pattern (1/0) Matrix | A binary table showing the presence/absence of a COG across all reference genomes, crucial for distribution analysis [2]. |
| antiSMASH Tool | Complementary tool for identifying biosynthetic gene clusters, often used in conjunction with COG analysis for natural product discovery [24]. ``` |
Pathway Deconstruction and Analysis Workflow
The functional categorization of bacterial genomes using the Clusters of Orthologous Genes (COG) database represents a cornerstone of modern microbial genomics. However, the efficacy of this research is profoundly dependent on the bioinformatics pipelines that enable it. Effective pipeline integration ensures analytical reproducibility, enhances computational efficiency, and facilitates the transformation of raw genomic data into biologically meaningful insights. Within this landscape, anvi'o has emerged as a powerful, flexible platform that supports both standardized analytical workflows and extensive customization. This application note details protocols for the integration of anvi'o into bioinformatics pipelines, focusing specifically on its capabilities for COG-based functional annotation and its interoperability with custom workflow architectures. We frame this discussion within the context of a broader thesis on the functional categorization of bacterial genomes, providing researchers, scientists, and drug development professionals with the practical methodologies needed to implement these approaches.
Anvi'o and COG Annotation: A Standardized Workflow
The anvi'o platform provides a streamlined and reproducible pathway for the functional annotation of bacterial genomes and metagenome-assembled genomes (MAGs) using the NCBI's COG database. This integrated workflow is a critical first step for any subsequent functional categorization analysis [25] [13].
Protocol: COG Annotation of Contigs with Anvi'o
The following step-by-step protocol enables researchers to annotate genes within a contigs database with COG functions.
Step 1: Software and Database Setup
- Install anvi'o: The platform is best installed within a Conda environment to manage dependencies [26].
- Setup NCBI COGs Data: Perform a one-time setup of the COG database on your system using anvi'o's setup command. This downloads and reformats necessary files from NCBI [13].
Step 2: Initialize the Analysis
- Generate a Contigs Database: From your assembled genomic data (FASTA file of contigs), create an anvi'o contigs database using
anvi-gen-contigs-database. This database stores invariant information about contigs, including k-mer frequencies, GC-content, and open reading frames [25] [26].
Step 3: Execute COG Annotation
- Run the COG Annotation Program: Use the
anvi-run-ncbi-cogsprogram to annotate genes in your contigs database.
Step 4: Downstream Analysis and Visualization
- The COG annotations are now available for interactive exploration in the anvi'o interactive interface, for binning refinement, or for export for further statistical analysis [26].
Key Programmatic Tools for COG Annotation
Table 1: Essential Anvi'o Programs for COG Annotation and Related Analyses
| Program Name | Function | Key Parameters | Output |
|---|---|---|---|
anvi-setup-ncbi-cogs |
One-time setup of COG database | --cog-data-dir, --reset |
Formatted COG data for local use |
anvi-run-ncbi-cogs |
Annotates genes in a contigs database with COGs | -c contigs-db, --search-with (diamond/blastp), -T (threads) |
Functions artifact stored in contigs database |
anvi-gen-contigs-database |
Creates a database from FASTA contigs | -f contigs.fasta, -o contigs.db |
Anvi'o contigs database |
anvi-interactive |
Launches interactive interface for visualization | -p PROFILE.db, -c CONTIGS.db |
Interactive display in a web browser |
Anvi'o in Custom Bioinformatics Workflows
While anvi'o provides a complete, integrated ecosystem for metagenomics, its architecture is modular, allowing its components to be embedded within larger, custom bioinformatics pipelines. This is essential for projects with specific analytical requirements that go beyond anvi'o's standard offerings.
Strategic Considerations for Workflow Integration
The integration of anvi'o into custom pipelines should be guided by several strategic principles [27]:
- Reproducibility and Scalability: Custom workflows must be designed to handle growing datasets efficiently. Anvi'o's reliance on self-contained SQLite databases and static HTML output facilitates the transfer and replication of analyses across different computing environments [25].
- Cost-Efficiency: Optimization of bioinformatics workflows can lead to substantial time and cost savings (30-75%), which is critical when processing large-scale genomic datasets [27].
- Modularity: Anvi'o should be treated as a suite of specialized tools rather than a monolithic application. Its individual programs (e.g.,
anvi-run-ncbi-cogsfor annotation,anvi-interactivefor visualization) can be called independently within a workflow orchestrated by systems like Nextflow or Snakemake [28].
A Model for Custom Workflow Development
A hybrid approach to pipeline development combines proven, open-source tools like anvi'o with custom-developed components. This model balances reliability with specificity [28]:
- Tool Selection: Identify the anvi'o modules required for your workflow (e.g., contig database generation, COG annotation, interactive binning).
- Custom Module Development: For analytical steps not covered by anvi'o, develop custom scripts or tools.
- Integration and Containerization: Package all components, including anvi'o and its dependencies, into containers (e.g., Docker, Singularity) to ensure consistency and portability.
- Orchestration: Use a workflow manager (e.g., Nextflow) to define the pipeline's execution logic, data flow, and resource allocation.
- Deployment: Deploy the finalized workflow across the target execution environment—cloud platform, HPC cluster, or on-premise server.
The diagram below illustrates the logical structure and data flow of a custom genomics pipeline that integrates anvi'o modules for specific tasks.
The Scientist's Toolkit: Essential Research Reagents and Materials
Successful execution of the protocols described herein requires a suite of computational "research reagents." The following table details the essential components.
Table 2: Key Research Reagent Solutions for Anvi'o and COG Workflows
| Item Name | Function/Definition | Application in Protocol |
|---|---|---|
| Contigs Database | An anvi'o database storing invariant contig information (sequences, k-mers, ORFs, etc.) [25]. | Central data structure for storing and retrieving contig data, gene calls, and COG annotations. |
| Profile Database | An anvi'o database storing sample-specific information (coverage, single-nucleotide variants) [25]. | Used in the interactive interface to visualize coverage across samples and perform binning. |
| NCBI COG Database | A phylogenetic classification of proteins from complete genomes into Clusters of Orthologous Groups [5]. | Serves as the reference database for functional annotation of predicted protein sequences. |
| DIAMOND | A high-throughput sequence aligner for protein and translated DNA searches, faster than BLAST [29]. | Default search program used by anvi-run-ncbi-cogs to find homologs in the COG database. |
| Conda Environment | A tool for creating isolated, reproducible software environments to manage dependencies. | Used for the installation of anvi'o and its specific Python version requirements without conflicts [26]. |
| Nextflow / Snakemake | Workflow orchestration frameworks for creating scalable and reproducible data pipelines [27]. | Enables the integration of anvi'o programs into larger, automated, and portable bioinformatics workflows. |
The integration of anvi'o into standardized and custom bioinformatics pipelines represents a powerful strategy for advancing research in the functional categorization of bacterial genomes. The platform's robust, built-in COG annotation workflow provides a reliable foundation for functional analysis, while its modular architecture offers the flexibility required for specialized investigative needs. By adhering to the detailed protocols for COG annotation and leveraging the strategic framework for custom workflow development outlined in this document, research teams can achieve reproducible, scalable, and efficient genomic analyses. This integrated approach ultimately accelerates the transformation of complex genomic data into actionable biological insights, with significant implications for microbial ecology, evolution, and drug discovery.
Functional annotation is a critical step in metagenomic studies that assigns biological meaning to the vast array of genes uncovered in microbial communities. For rhizosphere microbiology—the study of microorganisms inhabiting the plant root-soil interface—functional annotation provides insights into the metabolic processes, regulatory mechanisms, and ecological interactions that govern plant-microbe relationships. The Clusters of Orthologous Groups (COG) database serves as an indispensable tool for this purpose, offering a phylogenetic classification system based on evolutionary relationships that enables reliable functional prediction for proteins from diverse microbial communities [30] [31].
This case study explores the application of the COG database for functional profiling of rhizosphere metagenomes, with particular emphasis on understanding how microbial functions contribute to plant health and ecosystem functioning. We demonstrate standardized protocols for COG-based annotation, present experimental data from rhizosphere studies, and provide visualization tools to assist researchers in interpreting complex metagenomic datasets. The approaches outlined here are particularly valuable for investigating functional potential of rhizosphere microbiomes in agricultural systems, where understanding microbial contributions to plant growth and stress resistance can inform sustainable management practices [32] [33].
COG Database Fundamentals
Conceptual Framework
The COG database, established in 1997 and regularly updated since, organizes proteins from complete microbial genomes into Clusters of Orthologous Genes based on evolutionary relationships [30] [5]. Each COG comprises proteins inferred to be descended from a single ancestral protein, representing either orthologs (genes in different species that evolved through speciation events, typically retaining similar functions) or paralogs (genes related by duplication within a genome that may evolve new functions) [31]. This evolutionary framework enables more reliable functional predictions compared to sequence similarity alone, as orthologs typically maintain conserved biological roles across taxa.
The database's utility stems from three key features: (1) its foundation in complete microbial genomes enabling reliable ortholog/paralog identification; (2) an orthology-based approach that transfers functional information from characterized members to uncharacterized ones; and (3) careful manual curation of COG annotations aimed at detailed functional prediction while minimizing errors and overprediction [30]. The most recent 2024 update expanded coverage to 2,296 genomes (2,103 bacterial and 193 archaeal), representing a systematic effort to include at least one representative genome per genus, thereby significantly enhancing the database's comprehensiveness [5] [9].
Functional Classification System
The COG database categorizes proteins into 25 functional classes grouped into four major categories, providing a systematic framework for functional profiling of metagenomes [31]:
Table: COG Functional Categories
| Major Category | Functional Code | Functional Class |
|---|---|---|
| Information Storage and Processing | J | Translation, ribosomal structure and biogenesis |
| A | RNA processing and modification | |
| K | Transcription | |
| L | Replication, recombination and repair | |
| B | Chromatin structure and dynamics | |
| Cellular Processes and Signaling | D | Cell cycle control, cell division, chromosome partitioning |
| Y | Nuclear structure | |
| V | Defense mechanisms | |
| T | Signal transduction mechanisms | |
| M | Cell wall/membrane/envelope biogenesis | |
| N | Cell motility | |
| Z | Cytoskeleton | |
| W | Extracellular structures | |
| U | Intracellular trafficking, secretion, and vesicular transport | |
| O | Posttranslational modification, protein turnover, chaperones | |
| Metabolism | C | Energy production and conversion |
| G | Carbohydrate transport and metabolism | |
| E | Amino acid transport and metabolism | |
| F | Nucleotide transport and metabolism | |
| H | Coenzyme transport and metabolism | |
| I | Lipid transport and metabolism | |
| P | Inorganic ion transport and metabolism | |
| Q | Secondary metabolites biosynthesis, transport, and catabolism | |
| Poorly Characterized | R | General function prediction only |
| S | Function unknown |
This classification system enables researchers to quickly assess the functional potential of microbial communities and identify predominant biological processes in different environments [31].
Experimental Design and Workflow
Sample Collection and Metagenomic Sequencing
Rhizosphere sampling requires careful consideration of plant growth stage, soil properties, and spatial distribution of microbes. The following protocol outlines standardized methods for sample processing:
Rhizosphere Soil Collection: Gently uproot plants and shake to remove loosely adhered soil. Collect the tightly adhering soil (rhizosphere soil) by brushing roots or using sterile spatulas. For consistency, sample from multiple plants within the same treatment group [32] [33].
DNA Extraction: Use commercial soil DNA extraction kits with modifications for enhanced lysis of difficult-to-lyse microorganisms. Include mechanical disruption methods (bead beating) and chemical lysis. Quality check extracted DNA using fluorometric methods and gel electrophoresis [33].
Library Preparation and Sequencing: Prepare sequencing libraries using Illumina-compatible protocols with appropriate size selection. For shotgun metagenomics, aim for 10-20 million 150bp paired-end reads per sample to achieve sufficient coverage for functional annotation. Pool libraries and sequence on Illumina platforms (NovaSeq or HiSeq) [33].
The recently published study on basmati rice rhizosphere provides an exemplary model of this approach, where researchers collected samples from multiple geographical locations, extracted high-quality DNA, and generated substantial sequencing data (124-158 million base pairs per sample) for subsequent analysis [33].
Computational Workflow for COG Annotation
The bioinformatic pipeline for COG annotation involves multiple steps from quality control to functional classification, as visualized in the following workflow:
Diagram 1: Workflow for COG-based functional annotation of rhizosphere metagenomes.
Detailed Protocol Steps:
Quality Control and Filtering: Use FastQC for quality assessment and Trimmomatic for adapter removal and quality filtering. Remove low-quality reads (Phred score <20) and short sequences (<50bp) [33].
Metagenome Assembly: Perform de novo assembly using metaSPAdes or MEGAHIT with default parameters. Assess assembly quality using QUAST, focusing on metrics such as N50 (≥1345 bp in recent studies) and total assembly length [33].
Gene Prediction and Protein Extraction: Identify coding sequences using Prodigal with meta-mode option. Extract predicted protein sequences in FASTA format for subsequent analysis [34] [33].
COG Database Search: Conduct rpsBLAST searches against the COG database using webMGA server or standalone tools. rpsBLAST (Reverse Position-Specific BLAST) uses position-specific scoring matrices (PSSMs) for each COG, providing greater sensitivity for detecting distant homologs compared to standard BLAST [34]. Set e-value cutoff at 0.001 for balance between sensitivity and specificity.
Functional Classification and Quantification: Assign COG categories to each protein based on top hits. Count the number of proteins in each COG category and normalize by total assigned proteins to determine relative abundances [34].
This protocol can be adapted for high-performance computing environments and scaled for large-scale metagenomic projects. The webMGA platform provides a user-friendly interface for researchers without extensive bioinformatics infrastructure [34].
Case Study: Functional Profiling of Milkweed Rhizosphere Metagenomes
Study Background and Objectives
A recent investigation examined the functional potential of rhizosphere and phyllosphere microbiomes across three milkweed species (Asclepias curassavica, A. syriaca, and A. tuberosa) known to vary in their defensive chemical profiles [32]. The study aimed to: (1) identify evidence of microbial plant secondary metabolite (PSM) metabolism across milkweed species; (2) determine whether PSM metabolism is more prevalent in rhizosphere or phyllosphere communities; and (3) assess how insect herbivore feeding alters potential microbial PSM metabolism [32].
COG Functional Profiles
The milkweed study employed shotgun metagenomic sequencing followed by COG annotation to characterize functional differences between microbial communities. The resulting data revealed distinct functional specialization between rhizosphere and phyllosphere microbiomes:
Table: Comparative COG Functional Profiles in Milkweed Microbiomes
| COG Category | Rhizosphere Relative Abundance (%) | Phyllosphere Relative Abundance (%) | Predominant Functions |
|---|---|---|---|
| Carbohydrate Transport & Metabolism [G] | 12.4 | 8.7 | Sugar transporters, glycoside hydrolases |
| Amino Acid Transport & Metabolism [E] | 11.2 | 9.5 | Amino acid permeases, transaminases |
| Energy Production & Conversion [C] | 9.8 | 7.3 | ATP synthases, dehydrogenases |
| Transcription [K] | 8.5 | 10.2 | Transcription factors, RNA polymerase |
| Secondary Metabolite Biosynthesis [Q] | 6.7 | 3.1 | Polyketide synthases, non-ribosomal peptide synthetases |
| Inorganic Ion Transport [P] | 5.9 | 4.3 | Ion channels, metal transporters |
| Signal Transduction [T] | 5.2 | 7.8 | Two-component systems, serine/threonine kinases |
| Defense Mechanisms [V] | 4.3 | 5.1 | Antibiotic resistance, toxin-antitoxin systems |
| Function Unknown [S] | 15.7 | 18.4 | Uncharacterized proteins |
The data demonstrated significantly higher representation of metabolic COG categories (G, E, C, Q) in rhizosphere communities, reflecting their enhanced capacity for nutrient acquisition and specialized metabolism. Conversely, phyllosphere communities showed greater relative abundance of transcription and signal transduction functions, potentially indicating more dynamic responses to environmental fluctuations [32].
Specialized Metabolic Pathways
A key finding was the elevated potential for plant secondary metabolite (PSM) degradation in rhizosphere communities, with particular enrichment in COGs involved in detoxification of aromatic compounds, phenolic glycosides, and terpenoids [32]. The following diagram illustrates the relationship between milkweed defensive compounds and microbial degradation pathways:
Diagram 2: Microbial degradation pathways for milkweed defense compounds.
Notably, the research discovered an inverse relationship between plant defensive chemical profiles and the abundance of corresponding microbial degradation pathways, suggesting adaptation of rhizosphere microbiomes to specific host chemical environments [32]. This specialized metabolic capacity enables microbial communities to utilize plant defensive compounds as carbon and energy sources, potentially mitigating chemical defenses and creating favorable niches for microbial growth.
Case Study: Basmati Rice Rhizosphere Microbiome
Agricultural Context and Sampling Strategy
A comprehensive metagenomic study investigated the functional potential of rhizosphere microbiomes associated with aromatic basmati rice (Oryza sativa L.) accessions [33]. Given the economic importance of basmati rice and the role of microbiota in plant health and aroma development, researchers employed COG-based functional annotation to characterize microbial communities from three distinct geographical locations (Jammu, Samba, and Kathua) with varying soil properties.
Soil physicochemical analysis revealed slightly alkaline conditions (pH 8.3-8.8) with variations in available nitrogen, zinc, iron, and manganese concentrations between sampling locations [33]. These environmental factors significantly influenced microbiome composition and functional potential.
Aroma-Relevant Functional Pathways
The COG annotation of basmati rice rhizosphere metagenomes identified specific functional modules involved in the biosynthesis of aroma precursors:
Table: COG Categories Associated with Rice Aroma Enhancement
| COG ID | Category | Enzyme Function | Role in Aroma Biosynthesis |
|---|---|---|---|
| COG0524 | E | Acetylornithine aminotransferase | Ornithine biosynthesis |
| COG0423 | E | Acetylornithine deacetylase | Ornithine/putrescine pathway |
| COG0198 | E | N-acetylornithine carbamoyltransferase | Arginine/ornithine conversion |
| COG0525 | E | Acetylornithine/succinyldiaminopimelate aminotransferase | Diaminopimelate metabolism |
| COG2228 | E | Ornithine cyclodeaminase | Proline biosynthesis |
The study identified unique rhizobacteria (Actinobacteria, Bacillus subtilis, Burkholderia, Enterobacter, Klebsiella, Lactobacillus, Micrococcus, Pseudomonas, and Sinomonas) that harbored these aroma-relevant COGs [33]. These microbial functions contribute to the synthesis of ornithine, putrescine, proline, and polyamines—key precursors for 2-acetyl-1-pyrroline (2-AP), the primary aromatic compound responsible for basmati rice's distinctive fragrance.
The functional annotation revealed that introduction of specific plant growth-promoting rhizobacteria (PGPR) could enhance the expression of these aroma-relevant pathways, providing a sustainable approach to improving basmati rice quality while reducing dependence on inorganic fertilizers [33].
The Scientist's Toolkit
Successful functional annotation of rhizosphere metagenomes requires both laboratory reagents and bioinformatic tools. The following table summarizes key resources:
Table: Essential Resources for COG-Based Metagenomic Analysis
| Resource Category | Specific Tools/Reagents | Function/Application |
|---|---|---|
| DNA Extraction | Commercial soil DNA kits (e.g., MoBio PowerSoil) | High-quality metagenomic DNA extraction |
| Sequencing Reagents | Illumina sequencing kits | Library preparation and shotgun sequencing |
| Computational Tools | Prodigal | Gene prediction from metagenomic assemblies |
| rpsBLAST | COG annotation using position-specific scoring matrices | |
| webMGA server | Web-based metagenomic analysis platform | |
| Reference Databases | COG Database | Functional classification and orthology assignment |
| eggNOG Database | Expanded orthologous groups including eukaryotes | |
| Visualization Software | ggplot2 (R), Matplotlib (Python) | Data visualization and figure generation |
Database Access and Updates
The COG database is publicly accessible through the NCBI website (https://www.ncbi.nlm.nih.gov/research/COG) and FTP site (ftp://ftp.ncbi.nlm.nih.gov/pub/COG/) [5] [9]. The most recent 2024 update includes several important enhancements:
- Expansion to 2,296 genomes (2,103 bacterial and 193 archaeal), typically with one representative per genus
- 4981 COGs with updated annotations and references
- Addition of >100 new COGs for proteins involved in bacterial secretion pathways
- Inclusion of pathways for secretion systems (types II through X) and Flp/Tad pili
- Improved annotations for rRNA/tRNA modification proteins and signal transduction proteins [5] [9]
Researchers should note that while COG primarily covers bacterial and archaeal proteins, the related KOG database addresses eukaryotic orthologous groups, and the eggNOG database provides integrated coverage across all domains of life [35] [36].
Technical Considerations and Best Practices
Annotation Quality Control
Several factors influence the quality and reliability of COG-based functional annotations:
Database Selection: While COG provides excellent coverage for prokaryotic genomes, consider complementary databases (KEGG, Pfam, SwissProt) for more comprehensive annotation, particularly for eukaryotic components or specific protein families [35].
Parameter Optimization: Adjust e-value cutoffs (typically 0.001) and coverage thresholds based on research objectives. Stricter thresholds reduce false positives but may miss distant homologs.
Normalization Approaches: Normalize COG counts by either total predicted genes or single-copy universal COGs to enable cross-sample comparisons. The choice of normalization method can significantly impact results interpretation.
Multi-domain Proteins: For proteins matching multiple COGs, implement domain parsing algorithms to assign the most biologically relevant function [31].
Data Interpretation Guidelines
Effective interpretation of COG annotation results requires consideration of several analytical aspects:
Functional Redundancy: Multiple genes may contribute to the same metabolic function, complicating genotype-to-phenotype predictions.
Uncharacterized Proteins: Approximately 15-20% of proteins typically fall into "Function unknown" [S] or "General function prediction only" [R] categories [31]. These represent opportunities for novel discovery but complicate functional profiling.
Taxonomic Resolution: COG annotation provides functional information but limited taxonomic resolution. Consider coupling with taxonomic profiling for comprehensive community analysis.
Pathway Reconstruction: Individual COGs represent functional units rather than complete pathways. Use pathway databases (KEGG, MetaCyc) to reconstruct metabolic networks from COG components.
The continuous updates to the COG database, including refined annotations and expanded genomic coverage, have significantly enhanced its utility for functional metagenomics [30] [5] [9]. By following standardized protocols and considering these technical aspects, researchers can generate robust, reproducible functional profiles of rhizosphere microbiomes that provide insight into microbial contributions to plant health and ecosystem functioning.
Identifying Lifestyle-Associated Genes (LAGs) for Pathogen Research
The functional categorization of bacterial genomes is a cornerstone of microbial genomics, essential for deciphering the genetic basis of pathogenic lifestyles. The Clusters of Orthologous Groups (COG) database provides a robust phylogenetic framework for this purpose, serving as a platform for functional annotation of newly sequenced genomes and studies on genome evolution [16]. Each COG comprises proteins thought to be orthologous, connected through vertical evolutionary descent, which may involve one-to-one, one-to-many, or many-to-many relationships due to lineage-specific gene duplications [16].
Within this framework, identifying Lifestyle-Associated Genes (LAGs)—genes linked to specific ecological strategies such as pathogenicity—enables researchers to hypothesize about the molecular mechanisms underlying host-microbe interactions. The COG system classifies genes into 17 broad functional categories, facilitating the identification of functions overrepresented in pathogenic strains [16]. This application note details integrated computational and experimental protocols for the identification and validation of LAGs using the COG database, providing a standardized approach for researchers and drug development professionals.
Computational Identification of LAGs
Core Principles and Workflow
The identification of LAGs relies on comparative genomics to pinpoint genes with a distinct pattern of presence for a specific annotated lifestyle while being largely absent in others [37]. The following workflow integrates the COG database with modern comparative genomics tools.
Detailed Methodology
Genome Dataset Assembly and Curation
- Objective: Compile a high-quality genomic dataset representing diverse lifestyles (e.g., pathogenic, beneficial, environmental).
- Procedure:
- Select genomes from public repositories (e.g., NCBI RefSeq) based on documented lifestyle metadata.
- Reduce dataset redundancy by clustering genomes at ≥99% Average Nucleotide Identity (ANI) using tools like FastANI [37].
- Partition genomes into training and testing sets for model validation, ensuring balanced lifestyle representation.
Functional Annotation with the COG Database
- Objective: Assign standardized functional categories to gene products.
- Procedure:
- Use the COGNITOR program to assign protein sequences to pre-existing COGs through sequence similarity searches (e.g., BLAST, DIAMOND) against the COG database [16] [15].
- Apply manual validation to confirm orthology, particularly for new genomes without close relatives [16].
- Extract functional information and categorize genes according to the 17 major COG functional categories (e.g., "Translation," "Transcription," "Cell motility and secretion").
Table 1: Representative COG Genome Coverage from Select Species [16]
| Species | Total Proteins | Proteins in COGs | Coverage |
|---|---|---|---|
| Escherichia coli | 4,285 | 3,308 | 77% |
| Bacillus subtilis | 4,118 | 2,767 | 67% |
| Mycoplasma genitalium | 471 | 374 | 79% |
| Saccharomyces cerevisiae | 5,964 | 2,158 | 36% |
Comparative Genomic Analysis
- Objective: Identify gene clusters with distributions correlated to a target lifestyle.
- Procedure:
- Utilize computational frameworks like bacLIFE, which employs Markov Clustering (MCL) and MMseqs2 to group proteins into functional gene clusters (FGCs) across genomes [37].
- Generate a binary presence/absence matrix of all FGCs across all genomes in the dataset.
- Perform enrichment analysis (e.g., hypergeometric test) to identify FGCs statistically overrepresented in the target lifestyle group compared to control groups.
Lifestyle Prediction and LAG Identification
- Objective: Predict bacterial lifestyle and pinpoint candidate LAGs using machine learning.
- Procedure:
- Train a Random Forest classifier using the gene cluster presence/absence matrix as features and the known lifestyles as labels [37].
- Evaluate model performance using cross-validation and metrics like accuracy and F1-score.
- Extract feature importance scores from the trained model. Gene clusters with high importance for predicting the pathogenic lifestyle are considered predicted LAGs (pLAGs).
Experimental Validation of LAGs
Workflow for Functional Validation
Computational predictions require experimental confirmation. The following protocol outlines a standard functional validation pipeline using site-directed mutagenesis and phenotypic assays.
Detailed Experimental Protocol
Site-Directed Mutagenesis
- Objective: Generate isogenic mutant strains lacking the candidate LAG.
- Procedure:
- Vector Construction: Clone ~500 bp DNA fragments flanking the target gene into a suicide vector (e.g., pK18mobsacB).
- Conjugation: Introduce the construct into the wild-type bacterial strain via conjugation.
- Homologous Recombination: Select for single-crossover integrants. Sucrose counter-selection facilitates the second crossover event, yielding gene deletion mutants.
- Verification: Confirm gene deletion via colony PCR and Sanger sequencing.
Phenotypic Characterization (Plant Bioassay)
- Objective: Assess the contribution of the LAG to pathogenicity.
- Procedure:
- Inoculation: Grow wild-type and mutant strains to mid-log phase. Inoculate susceptible host plants (e.g., rice for Burkholderia plantarii, bean for Pseudomonas syringae) via leaf infiltration, root immersion, or other relevant methods.
- Disease Assessment: Incubate plants under controlled conditions. Monitor and quantify disease symptoms (e.g., lesion size, leaf chlorosis, plant weight reduction) over 3-14 days.
- Bacterial Load Measurement: At experiment endpoint, harvest and homogenize inoculated tissues. Plate serial dilutions on solid medium to count bacterial colony-forming units (CFU).
Genetic Complementarity Test
- Objective: Confirm that the observed phenotypic defect is directly due to the deleted gene.
- Procedure:
- Clone the wild-type allele of the candidate LAG, including its native promoter, into a stable plasmid vector.
- Introduce the complementation construct into the mutant strain.
- Repeat the phenotypic assay. Restoration of wild-type pathogenicity confirms the gene's functional role.
Representative Validation Results
Table 2: Example Experimental Validation of Predicted LAGs [37]
| Target Species | Predicted LAG Function | Validation Outcome | Key Phenotype in Mutant |
|---|---|---|---|
| Burkholderia plantarii | Glycosyltransferase | Confirmed | Significant reduction in virulence on rice |
| Burkholderia plantarii | Extracellular binding protein | Confirmed | Significant reduction in virulence on rice |
| Burkholderia plantarii | Homoserine dehydrogenase | Confirmed | Significant reduction in virulence on rice |
| Pseudomonas syringae pv. phaseolicola | Non-Ribosomal Peptide Synthetase (NRPS) | Confirmed | Abolished pathogenicity on bean |
Table 3: Key Research Reagent Solutions for LAG Identification and Validation
| Reagent/Resource | Function/Description | Example/Source |
|---|---|---|
| COG Database | Phylogenetic classification of proteins from complete genomes for functional annotation. | https://www.ncbi.nlm.nih.gov/COG [16] |
| bacLIFE Workflow | Integrated computational pipeline for genome annotation, comparative genomics, and LAG prediction. | https://github.com/Carrion-lab/bacLIFE [37] |
| Suicide Vector | Plasmid for generating stable gene knockouts via homologous recombination (e.g., contains sacB for counter-selection). | pK18mobsacB [37] |
| Functional Annotation Tools | Alternative platforms for functional enrichment analysis of gene lists. | DAVID [38], FunMappOne [39] |
| Sequence Clustering Tools | Software for efficient and sensitive protein sequence clustering to define gene families. | MMseqs2 [37] |
This application note outlines a comprehensive, actionable pipeline for identifying and validating Lifestyle-Associated Genes. The strength of this approach lies in the synergy between robust phylogenetic classification via the COG database [16] and powerful comparative genomics enabled by tools like bacLIFE [37]. The outlined experimental protocol provides a direct path for transitioning from in silico predictions to biologically validated mechanisms, accelerating the discovery of therapeutic targets and the development of strategies to control bacterial pathogens.
Overcoming Challenges: Best Practices for Accurate COG Assignment and Analysis
The functional categorization of bacterial genomes using the Clusters of Orthologous Groups (COG) database represents a cornerstone of modern comparative genomics [2]. Accurate annotation hinges upon the precise distinction between two fundamentally different types of homologous relationships: orthology and paralogy [40] [41]. Orthologs are genes related by speciation events, typically retaining the same biological function across different species. Paralogs are genes related by duplication events within a genome, which often diverge in function [42] [43]. The COG database itself is constructed from phylogenetically classified orthologous groups across multiple complete microbial genomes, making the correct identification of these relationships paramount for reliable functional prediction [2].
However, researchers employing tools like COGNITOR for automated COG assignment frequently encounter errors stemming from the misclassification of these relationships. Such misclassifications can propagate incorrect functional annotations across databases, compromising subsequent genomic analyses and biological interpretations. This Application Note delineates the primary sources of these errors and provides detailed protocols for their resolution, framed within the broader context of robust bacterial genome annotation for research and drug development.
Theoretical Foundation: Defining the Units of Orthology
Core Definitions and Evolutionary Concepts
The concepts of orthology and paralogy were first introduced by Walter Fitch to distinguish between homologous genes based on their evolutionary descent [40]. Orthologs (from 'ortho', meaning 'exact') are genes originating from a common ancestral gene that diverged due to a speciation event. Conversely, paralogs (from 'para', meaning 'beside') originate from gene duplication events within a single genome [40] [42]. A critical, often-overlooked aspect is that these definitions are inherently hierarchical. The relationship between two genes can only be defined relative to a specific speciation event in their evolutionary history [40].
The standard assumption, often termed the "orthology conjecture," posits that orthologous genes are most likely to retain conserved biological functions across different organisms, making them prime candidates for functional annotation transfer [40] [44]. However, this conjecture is not universally absolute. Recent large-scale functional genomic studies in mammals have surprisingly revealed that paralogs within the same species can sometimes be more functionally similar than orthologs between species, potentially due to shared cellular context [44]. This complexity underscores the need for careful analysis rather than reliance on simplistic assumptions.
Complexities in Real-World Genomes
In practice, evolutionary scenarios are often complex. Simple one-to-one orthologous relationships are frequently complicated by lineage-specific gene duplications and losses, leading to co-orthology (one-to-many or many-to-many relationships) [40] [2]. The terms in-paralogs and out-paralogs were introduced to distinguish between paralogous genes that duplicated after or before a given speciation event, respectively [40]. This is a crucial distinction for functional annotation.
Furthermore, the traditional genocentric view of orthology is increasingly seen as an oversimplification. Differences in protein domain architectures among genes deemed orthologous are common, particularly in eukaryotes, suggesting that the true unit of orthology may be a stable protein domain rather than an entire gene [40]. This is especially problematic when dealing with repetitive, promiscuous domains (e.g., ankyrin repeats), where the standard concept of orthology can break down entirely [40].
Table 1: Key Concepts in Homologous Gene Classification
| Term | Definition | Evolutionary Mechanism | Typical Functional Relationship |
|---|---|---|---|
| Ortholog | Genes in different species originating from a single ancestral gene in the last common ancestor | Speciation | Often retain equivalent core biological function [40] |
| Paralog | Genes in the same genome originating from a gene duplication event | Gene Duplication | Often diverge in function (neo-functionalization or subfunctionalization) [42] |
| In-paralog | A paralog that arose from a duplication event after a given speciation event | Recent Gene Duplication | Function may be highly similar or specialized [40] |
| Out-paralog | A paralog that arose from a duplication event before a given speciation event | Ancient Gene Duplication | Function is more likely to have diverged [40] |
| Co-ortholog | A gene that has multiple orthologs in another genome due to lineage-specific duplication | Speciation followed by Duplication | One-to-many or many-to-many functional relationships [40] [2] |
Misclassification errors when using COGNITOR primarily arise from three areas: the challenge of differentiating in-paralogs from out-paralogs, issues with domain architecture complexity, and the limitations of simple sequence similarity thresholds.
Error Source 1: Misclassification of In-Paralogs vs. Out-Paralogs
Problem: COGNITOR may assign all hits within a genome to the same COG, failing to distinguish recent, lineage-specific in-paralogs from ancient out-paralogs. This can lead to an over-inflation of the core genome and incorrect inference of gene essentiality if in-paralogs are not properly collapsed [40] [2].
Resolution Protocol 1: Phylogenetic Tree Reconciliation
- Sequence Collection: For the COG group in question, collect protein sequences from your target organism and several representative reference genomes.
- Multiple Sequence Alignment: Perform a high-quality alignment using tools like MAFFT or MUSCLE.
- Tree Construction: Generate a gene tree using a maximum likelihood method (e.g., RAxML or IQ-TREE).
- Species Tree Reference: Obtain a trusted species tree for the organisms involved.
- Reconciliation: Use tree reconciliation software (e.g., Notung, RANGER-DTL) to map the gene tree onto the species tree. This algorithm will explicitly identify duplication nodes.
- Classification: Genes clustering on a branch descendant from a duplication node that predates the relevant speciation are out-paralogs. Those from a lineage-specific duplication are in-paralogs and should be treated as co-orthologs.
Error Source 2: Domain Architecture Complexity
Problem: A query protein may have a complex multi-domain architecture. COGNITOR might assign the entire protein to a COG based on a single, highly conserved domain, while other domains suggest a different classification or a novel, lineage-specific fusion [40]. This violates the genocentric orthology assumption.
Resolution Protocol 2: Domain-Centric Re-annotation
- Domain Identification: Run the query protein sequence against domain databases such as Pfam, SMART, and CDD using HMMER or RPS-BLAST [2].
- Architecture Comparison: Compare the full domain architecture of the query protein against all proteins in the assigned COG.
- Consistency Check: If the domain architecture of the query is significantly different (e.g., missing domains, extra domains, different order), the COG assignment is likely erroneous.
- Re-assignment: The protein may belong to a different COG, or it may represent a novel gene family that requires manual curation. Functional annotation should be based on the composite domain functions.
Error Source 3: Over-reliance on Sequence Similarity Thresholds
Problem: Using arbitrary BLAST E-value or percent identity cutoffs can be misleading. Some orthologous relationships, especially for short or rapidly evolving proteins, may have low sequence similarity, while some distant paralogs might retain significant similarity [2].
Resolution Protocol 3: Reciprocal Best Hits (RBH) with Synteny Validation
- Perform RBH Analysis: For a query gene in organism A, find its best hit (BLAST/DIAMOND) in organism B. Then, use that hit as a query back against the proteome of organism A.
- Check Reciprocity: If the best hit in the reverse search is the original query gene, the pair is a Reciprocal Best Hit, a strong indicator of orthology [45] [2].
- Validate with Synteny: Examine the genomic neighborhood surrounding the query gene and its putative ortholog. Conserved gene order (synteny) provides powerful corroborating evidence for orthology.
- Iterate: This process should be repeated for multiple genomes to build robust orthologous groups, which is the foundational principle behind methods like OrthoMCL [45].
The following diagram illustrates a consolidated workflow for resolving COGNITOR errors by integrating these protocols.
Figure 1: A unified workflow for resolving common COGNITOR classification errors through phylogenetic, domain-based, and synteny-based validation.
Successful resolution of orthology/paralogy distinctions requires a suite of bioinformatics tools and databases. The following table details key resources, their primary functions, and their application in the protocols described above.
Table 2: Essential Research Reagents and Resources for Orthology Analysis
| Resource Name | Type | Primary Function in Analysis | Application in Protocols |
|---|---|---|---|
| COG Database [2] | Curated Protein Family Database | Provides reference Clusters of Orthologous Groups for functional classification | Baseline for assignment; used in all protocols to define group boundaries. |
| OrthoMCL [45] | Orthology Clustering Algorithm | Groups orthologous protein sequences across multiple taxa using a Markov Clustering algorithm. | Protocol 3; provides an alternative, automated clustering for comparison. |
| eggNOG [46] [2] | Orthology Database | A scalable, non-supervised extension of COG covering a vast number of genomes. | Protocol 1 & 3; useful for broad phylogenetic context and functional annotations. |
| Pfam / CDD [46] [2] | Protein Domain Database | Identifies and classifies conserved protein domains and families. | Protocol 2; critical for domain-centric analysis and architecture comparison. |
| MAFFT / MUSCLE | Multiple Sequence Alignment Tool | Generates accurate alignments of homologous protein sequences. | Protocol 1; essential pre-step for phylogenetic tree construction. |
| RAxML / IQ-TREE | Phylogenetic Inference Tool | Constructs maximum likelihood phylogenetic trees from sequence alignments. | Protocol 1; generates the gene tree for reconciliation. |
| Notung | Tree Reconciliation Software | Maps gene trees onto species trees to infer duplication and loss events. | Protocol 1; automates the identification of in-paralogs and out-paralogs. |
| DIAMOND [47] | Sequence Similarity Search Tool | A high-performance BLAST-compatible tool for fast sequence comparisons. | Protocol 3; enables rapid Reciprocal Best Hit analysis against large databases. |
| EDGAR [47] | Comparative Genomics Platform | Provides features for functional category analysis and pangenome subsets. | Post-resolution; useful for analyzing the functional impact of corrected assignments. |
Concluding Remarks
The distinction between orthology and paralogy is not merely a taxonomic exercise but a fundamental requirement for accurate functional genomic annotation. Errors in COGNITOR assignments, often stemming from the misapplication of these concepts, can be systematically identified and resolved through the integrated use of phylogenetic, domain-based, and synteny-based protocols. By adopting the detailed methodologies and resources outlined in this Application Note, researchers can significantly enhance the reliability of their COG-based functional categorizations, thereby strengthening downstream analyses in bacterial genomics and drug discovery pipelines. A rigorous, multi-faceted approach is the most robust defense against the propagation of annotation errors in public databases.
Handling Multidomain Proteins and Gene Splitting in Assignments
The functional categorization of bacterial genomes using the Clusters of Orthologous Genes (COG) database is a cornerstone of modern comparative genomics. However, the accurate assignment of protein functions faces significant challenges when confronted with multidomain proteins and complex gene structures. Multidomain proteins, which constitute a substantial fraction of prokaryotic and eukaryotic proteomes, complicate functional classification because they combine multiple evolutionary and functional units into single polypeptide chains. Similarly, accurate gene structure annotation is prerequisite for correct COG assignment, yet non-canonical splicing patterns and microexons frequently lead to annotation errors. This article presents integrated experimental and computational protocols to address these challenges, enabling researchers to achieve more reliable functional categorization within bacterial genome projects.
The COG database provides a systematic framework for classifying orthologous gene products across multiple microbial genomes. As of recent updates, the database encompasses a substantial proportion of available microbial diversity.
Table 1: COG Database Composition Statistics (2024 Update)
| Metric | Value | Description |
|---|---|---|
| Total COGs | 5,061 | Distinct clusters of orthologous genes [5] |
| Bacterial Genomes | 2,103 | Species represented in the database [5] |
| Archaeal Genomes | 193 | Species represented in the database [5] |
| Total Genomic Loci | 6,266,336 | Individual gene loci classified [5] |
| Protein IDs | 5,872,258 | Unique protein sequences covered [5] |
The challenge of multidomain proteins is substantial, with approximately two-thirds of prokaryotic proteins incorporating multiple domains [48]. These complex proteins necessitate specialized approaches for accurate structural prediction and functional annotation, as traditional single-domain-focused methods often fail to capture their complete biological role.
Experimental Protocols for Multidomain Protein Analysis
Domain-Centric Structural Modeling with D-I-TASSER
The D-I-TASSER (deep-learning-based iterative threading assembly refinement) pipeline represents a hybrid approach that integrates deep learning with physical force fields for modeling multidomain protein structures.
Table 2: D-I-TASSER Benchmark Performance on Single and Multidomain Proteins
| Method | Average TM-score (Hard Targets) | Correct Fold (TM-score >0.5) | Key Advantage |
|---|---|---|---|
| D-I-TASSER | 0.870 | 480/500 (96%) | Integrated domain partitioning & assembly [48] |
| AlphaFold2.3 | 0.829 | Not Reported | End-to-end learning architecture [48] |
| AlphaFold3 | 0.849 | Not Reported | Diffusion sample integration [48] |
| C-I-TASSER | 0.569 | 329/500 (66%) | Contact-based deep learning restraints [48] |
| I-TASSER | 0.419 | 145/500 (29%) | Traditional threading assembly [48] |
Protocol: D-I-TASSER for Multidomain Proteins
- Input Preparation: Obtain the target protein sequence in FASTA format. Ensure sequence quality and check for any existing annotations.
- Deep Multiple Sequence Alignment (MSA) Construction: Iteratively search genomic and metagenomic databases using tools like HHblits and JackHMMER to construct comprehensive MSAs.
- Spatial Restraint Generation: Generate multiple spatial restraints using:
- DeepPotential (residual convolutional networks)
- AttentionPotential (self-attention transformers)
- AlphaFold2 (end-to-end neural networks)
- Domain Boundary Prediction: Implement the domain partition module to identify putative domain boundaries within the query sequence.
- Domain-Level Modeling: For each identified domain, create domain-specific MSAs, threading alignments, and spatial restraints.
- Full-Chain Assembly: Execute replica-exchange Monte Carlo (REMC) simulations to assemble full-length models guided by hybrid domain-level and interdomain spatial restraints.
- Model Selection and Validation: Select top models based on structural quality assessment scores (e.g., TM-score, C-score) and validate using molecular dynamics simulations.
The critical innovation in D-I-TASSER for multidomain proteins is the iterative domain splitting and reassembly module, which separately processes individual domains before assembling them into full-length structures with appropriate interdomain interactions [48].
Multi-Domain Architecture (MDA) Comparison for Functional Inference
Gene3D provides a complementary approach for analyzing protein domains and their arrangements, offering insights into function through domain architecture comparison.
Protocol: MDA Similarity Analysis Using Gene3D
- Domain Assignment: Assign domains to query sequences using the Gene3D pipeline, which incorporates CATH, Pfam, and SUPERFAMILY annotations through the DomainFinder algorithm to resolve overlapping assignments [49].
- MDA Representation: Represent each protein as a string of domain families (the MDA), ordered by their appearance along the sequence.
- Architecture Alignment: Use the modified Needleman-Wunsch dynamic programming algorithm to align domain strings between proteins, with a substitution matrix that scores matches at different hierarchical levels:
- Identical FunFams (most specific)
- Similar FunFams based on hierarchical trees
- Identical domain superfamilies (homology)
- Same structural fold (least specific)
- Similarity Scoring: Calculate alignment scores with mismatch penalties of -1.0 and gap penalties of -0.01 to identify proteins with related domain architectures.
- Functional Transfer: Infer potential functional relationships for proteins with highly similar MDAs, particularly those sharing identical FunFam assignments [49].
This MDA comparison method allows researchers to identify proteins with similar "domain grammar" even in the absence of significant sequence similarity, facilitating functional predictions for multidomain proteins.
Addressing Gene Splitting and Annotation Challenges
Accurate gene annotation is fundamental to correct COG assignment, but several splicing-related phenomena frequently cause errors in automated annotation pipelines.
Challenges in Gene Structure Annotation
Nonconsensus Splice Sites: While most splice sites conform to GT-AG consensus, several exceptions complicate prediction:
- GC 5' splice sites (~0.5% of sites) recognized by the standard spliceosome [50]
- U12 introns with distinct sequences processed by the minor spliceosome [50]
- Rare nonconsensus sites that deviate from both major patterns [50]
Noncoding Exons: Present in >35% of human genes, these exons lack coding sequence features and are frequently missed by gene-finding software that focuses on coding potential [50].
Microexons: Internal exons can be extremely small (<10 nucleotides), confounding both gene prediction and cDNA-to-genome alignment algorithms. Some extreme cases involve "exons" of zero length (resplicing sites) [50].
Protocol: DNA Foundation Models for Nucleotide-Resolution Annotation
SegmentNT represents a modern approach to genome annotation that frames the problem as multilabel semantic segmentation at single-nucleotide resolution.
Protocol: SegmentNT for Accurate Gene Element Annotation
- Model Selection: Choose appropriate SegmentNT model based on sequence length requirements:
- SegmentNT-3kb for focused regional analysis
- SegmentNT-10kb for longer genomic contexts
- SegmentNT-30kb for comprehensive gene coverage
- Input Sequence Preparation: Extract genomic DNA sequences of appropriate length, ensuring test chromosomes are excluded from training data to prevent data leakage.
- Element Segmentation: Process sequences through SegmentNT to generate binary masks for 14 genomic element types:
- Gene elements: protein-coding genes, lncRNAs, 5'UTR, 3'UTR, exons, introns, splice acceptors, splice donors
- Regulatory elements: poly(A) signals, tissue-invariant promoters, tissue-specific promoters, enhancers, CTCF-bound sites
- Prediction Thresholding: Apply a threshold of 0.5 to annotate nucleotides as belonging to each element type.
- Performance Validation: Assess predictions using multiple metrics: Matthews correlation coefficient (MCC), area under precision-recall curve (auPRC), Jaccard similarity, F1-score, and segment overlap score (SOV) [51].
SegmentNT leverages pretrained DNA foundation models (Nucleotide Transformer) combined with a 1D U-Net architecture to achieve state-of-the-art performance on gene annotation, particularly for protein-coding genes, exons, introns, and splice sites [51].
Integrated Workflow for COG Assignment of Complex Proteins
Integrated Multidomain Protein Analysis Workflow
Table 3: Key Computational Resources for Multidomain Protein and Gene Analysis
| Resource | Type | Primary Function | Application Context |
|---|---|---|---|
| COG Database | Database | Cluster of Orthologous Genes | Functional categorization of prokaryotic proteins [5] |
| D-I-TASSER | Modeling Suite | Hybrid deep learning/physics-based structure prediction | Single-domain and multidomain protein 3D structure modeling [48] |
| SegmentNT | Annotation Model | DNA sequence segmentation at nucleotide resolution | Accurate gene element and regulatory region annotation [51] |
| Gene3D | Domain Database | Multi-domain architecture analysis | Domain assignment and MDA comparison for functional inference [49] |
| CATH | Domain Database | Structural domain classification | Source of domain definitions and superfamily assignments [49] |
| LOMETS3 | Threading Server | Meta-threading for template identification | Template identification in D-I-TASSER pipeline [48] |
The integration of advanced structural modeling approaches like D-I-TASSER for multidomain proteins with nucleotide-precision annotation tools like SegmentNT provides a powerful framework for addressing the persistent challenges in COG-based functional categorization. The protocols outlined in this article enable researchers to more accurately handle complex gene structures and multidomain architectures, leading to more reliable functional predictions in bacterial genome annotation projects. As these methods continue to evolve, they will further bridge the gap between sequence information and biological function, enhancing our understanding of microbial genomics and opening new avenues for drug discovery and biotechnology applications.
The Clusters of Orthologous Genes (COG) database is an essential resource for the functional annotation of prokaryotic genomes through phylogenetic classification. Maintaining database currency—ensuring access to the most current data while preserving version integrity—is fundamental to robust genomic research. The COG database at the National Center for Biotechnology Information (NCBI) implements a structured system for incremental updates and version control, enabling researchers to track the evolution of protein families across thousands of microbial genomes. This framework is particularly critical for comparative genomics studies investigating bacterial pathogenesis, antibiotic resistance, and evolutionary adaptation [9] [11].
The COG database has undergone significant evolution since its inception in 1997, with updates in 2003, 2014, 2021, and most recently in 2024 [11]. Each release incorporates newly sequenced genomes and refines functional annotations, necessitating systematic approaches to data management. The 2024 update expanded coverage to 2,296 genomes (2,103 bacteria and 193 archaea) and increased the number of COGs from 4,877 to 4,981, primarily adding protein families involved in bacterial secretion systems [5] [11]. This expansion highlights the critical need for effective version control strategies to maintain research reproducibility while leveraging the most current genomic data.
COG Database Update Statistics and Version History
Table 1: COG Database Version History and Coverage Statistics
| Release Year | Genomes Covered | Bacterial Genomes | Archaeal Genomes | Total COGs | Key Updates |
|---|---|---|---|---|---|
| 1997 [3] | 7 | 6 | 1 | 720 | Initial database creation |
| 2000 [3] | 21 | 16 | 4 | 2,091 | Expanded microbial diversity |
| 2003 [4] | 66 | 63 | 3 | 4,873 | Added unicellular eukaryotes |
| 2014 [9] | 1,309 | 1,187 | 122 | 4,877 | Major genome expansion, RefSeq integration |
| 2021 [9] | 1,309 | 1,187 | 122 | 4,877 | Improved annotations, added CRISPR-associated COGs |
| 2024 [5] | 2,296 | 2,103 | 193 | 4,981 | Added secretion system proteins, expanded pathway groupings |
Table 2: Current COG Database Composition (2024 Update)
| Component | Count | Description |
|---|---|---|
| COGs | 5,061 | Phylogenetic protein families |
| Genomic Loci | 6,266,336 | Unique gene positions mapped |
| Taxonomic Categories | 42 | Major phylogenetic groups |
| Organisms | 2,296 | Species representatives |
| Protein IDs | 5,872,258 | Individual protein sequences |
| COG Symbols | 4,106 | Unique functional identifiers |
The quantitative expansion of the COG database demonstrates the necessity of structured update protocols. The 2024 update implemented a single representative genome per genus approach to maximize phylogenetic diversity while minimizing redundancy [11]. This curation strategy enhances the database's utility for comparative genomics while introducing specific version control challenges. Researchers must now distinguish between genus-level orthology predictions and species-specific variations when analyzing newly sequenced organisms.
Incremental Update Mechanisms and Architecture
COG Database Update Framework
The COG database employs a sophisticated incremental update system that balances the integration of new genomic data with the preservation of stable orthologous groups. The update architecture follows a multi-stage process:
Genome Selection: Newly sequenced prokaryotic genomes meeting quality thresholds (complete assembly level, CheckM completeness ≥95%, contamination <5%) are identified from NCBI RefSeq [52] [11].
Orthology Assessment: The COGNITOR program applies the consistency of genome-specific best hits principle to assign new proteins to existing COGs [3]. This algorithm requires a protein to show significant similarity (BLAST e-value < 0.01) to at least three existing COG members from different phylogenetic lineages [3] [6].
New COG Formation: Proteins not assigned to existing COGs undergo the triangle-based clustering procedure to form novel COGs, requiring at least three genes from evolutionarily distant organisms [3].
Manual Curation: Domain experts examine automated assignments, split multidomain proteins, refine functional annotations, and validate phylogenetic patterns [3] [11].
The update process incorporates version control through dedicated FTP directories with archival of previous releases. The NCBI FTP site (ftp.ncbi.nlm.nih.gov/pub/COG/) maintains separate folders for each major update (e.g., COG2024), allowing researchers to access specific versions for reproducible analysis [5] [11].
Data Integration and Quality Control
The COG database maintains data integrity through rigorous quality control measures during incremental updates. Each newly added genome undergoes:
- Completeness Assessment: Using CheckM to verify ≥95% completeness for single-copy genes [52]
- Contamination Screening: Implementing <5% contamination threshold to exclude compromised genomes [52]
- Taxonomic Validation: Ensuring accurate phylogenetic placement before inclusion [52]
- Domain Architecture Analysis: Splitting multidomain proteins to prevent artifactual lumping of distinct COGs [3]
These protocols ensure that incremental updates enhance database coverage while maintaining phylogenetic accuracy and functional reliability. The 2024 update specifically improved annotations for rRNA/tRNA modification proteins, multi-domain signal transduction proteins, and previously uncharacterized protein families [11].
Experimental Protocols for Version-Controlled COG Analysis
Objective: Maintain a local mirror of the COG database that tracks incremental updates while preserving version history for reproducible research.
Table 3: Research Reagent Solutions for COG Database Management
| Reagent/Resource | Function | Access Protocol |
|---|---|---|
| NCBI COG FTP Site | Primary data distribution | FTP/RSYNC (ftp.ncbi.nlm.nih.gov/pub/COG/) |
| COG Website Interface | Interactive query and browsing | HTTPS (www.ncbi.nlm.nih.gov/research/COG) |
| COGNITOR Program | Orthology assignment for new sequences | Standalone algorithm [3] |
| RPS-BLAST | Domain identification and COG mapping | Local installation with e-value 0.01 threshold [52] |
| Custom Python Scripts | Version comparison and change tracking | GitHub repository (e.g., moshi4/COGclassifier) [53] |
Materials:
- Computing infrastructure with ≥16GB RAM and ≥500GB storage
- Internet connectivity for NCBI FTP access (ftp.ncbi.nlm.nih.gov/pub/COG/)
- UNIX/Linux environment with wget, rsync, and git
- Python 3.8+ with pandas, biopython libraries
- PostgreSQL or MySQL database for local storage
Procedure:
- Establish Baseline Version:
Configure Automated Update Detection:
Implement Incremental Download Protocol:
Execute Version Comparison:
Update Local Database:
- Import new COG definitions to local relational database
- Maintain version history table with timestamps
- Preserve previous versions for reproducible analysis
Validation: Execute consistency checks on imported data by verifying that all COGs contain proteins from at least three phylogenetically distinct lineages [3].
Protocol 2: Version-Aware Functional Annotation of Bacterial Genomes
Objective: Annotate bacterial genome sequences using the COG database while maintaining explicit version control for reproducible functional categorization.
Materials:
- Bacterial genome sequences in FASTA format
- COG database local mirror with version tracking
- BLAST+ suite (version 2.15.0 or higher) [52]
- RPS-BLAST for domain identification [52]
- High-performance computing cluster (recommended for large datasets)
Procedure:
- Sequence Preprocessing:
- Predict open reading frames using Prokka v1.14.6 or similar tool [52]
- Format predicted protein sequences as FASTA for analysis
COG Assignment Using COGNITOR Protocol:
Multi-Domain Protein Handling:
- Execute RPS-BLAST against conserved domain database
- Split multidomain proteins into constituent domains
- Assign domains to appropriate COGs independently [3]
Functional Categorization:
- Map assigned COGs to functional categories (J: Translation; K: Transcription; etc.)
- Generate quantitative summary statistics per genome
- Record COG functional category assignments with version metadata
Version Control Documentation:
- Include COG database version in all output files
- Archive assignment parameters and software versions
- Generate checksums for input sequences and results
Validation: Assess annotation quality by verifying that essential single-copy COGs are detected in complete bacterial genomes [52].
Application in Bacterial Genomics Research
The version-controlled COG framework enables sophisticated comparative genomics analyses that track functional evolution across bacterial lineages. Implementation case study:
Research Context: Investigation of host adaptation mechanisms in pathogenic bacteria using 4,366 high-quality genomes from diverse ecological niches [52].
Version Control Implementation:
- Frozen COG database version (2021 release) used for all analyses
- Explicit version tracking in methods documentation
- Reproducible annotation pipeline with parameter archival
Experimental Workflow:
- COG Functional Profiling:
- Annotated all genomes using consistent COG version
- Mapped proteins to COG categories with RPS-BLAST (e-value 0.01, coverage ≥70%) [52]
- Generated phyletic patterns for each COG across host environments
Statistical Analysis:
- Identified COGs enriched in human-associated bacteria versus environmental isolates
- Discovered significant enrichment of carbohydrate-active enzyme genes in human pathogens [52]
- Detected lineage-specific adaptation strategies: gene acquisition in Pseudomonadota versus genome reduction in Actinomycetota [52]
Evolutionary Inference:
- Utilized COG phyletic patterns to infer gene gain/loss events
- Mapped adaptive mutations to specific COG functional categories
- Identified hypB as a potential human host-specific signature gene [52]
This research demonstrates how version-controlled COG analysis enables robust identification of niche-specific genomic features and adaptive mechanisms in bacterial pathogens.
Systematic management of incremental updates and version control in the COG database is fundamental to advancing research in bacterial genomics. The structured protocols presented here provide a framework for maintaining database currency while ensuring research reproducibility. As the COG database continues to expand—incorporating new genomes and refining functional annotations—implementing rigorous version control practices becomes increasingly critical. The application of these protocols in comparative genomics studies enables researchers to track the functional evolution of bacterial pathogens, identify adaptation mechanisms, and elucidate host-pathogen interactions with high confidence in result reproducibility. Future developments should focus on automated version-tracking systems and enhanced computational infrastructure to manage the growing scale of genomic data while maintaining backward compatibility for longitudinal studies.
Large-scale comparative genomics is fundamental to modern microbiology, enabling researchers to decipher the genetic basis of bacterial functions, from virulence and antibiotic resistance to ecological adaptation. The Clusters of Orthologous Groups (COG) database serves as a cornerstone for these efforts, providing a phylogenetic classification of proteins from complete genomes that is critical for functional annotation and evolutionary studies [3] [9]. However, the exponential growth of genomic data—with repositories like the Genome Taxonomy Database (GTDB) expanding from 402,709 to 732,475 bacterial and archaeal genomes between 2023 and 2025—presents severe computational challenges [54]. Laboratories can now generate terabyte or even petabyte-scale data sets at reasonable cost, but the computational infrastructure required to store, process, and analyze these data often exceeds the capabilities of individual research groups [55]. This application note provides detailed protocols and strategies for optimizing computational workflows in large-scale comparative genomic analyses, with specific focus on the COG framework, to enable efficient and impactful bacterial genomics research.
Computational Challenges in Large-Scale Genomics
The analysis of large genomic datasets encounters several critical bottlenecks that can hinder research progress and increase costs. Understanding these constraints is essential for selecting appropriate computational strategies and resource allocation.
Table 1: Key Computational Challenges in Large-Scale Genomic Analyses
| Challenge Category | Specific Limitations | Impact on Research |
|---|---|---|
| Data Transfer & Management | Network speeds too slow for terabyte-scale transfers; requires physical shipping of storage drives [55] | Creates barriers to data sharing and collaboration; increases project timelines |
| Storage Infrastructure | Index sizes can be 21.25× larger than the original 2-bit encoded genome [56] | Limits ability to share indexes across networks; requires expensive memory resources |
| Computational Intensity | NP-hard problems (e.g., Bayesian network reconstruction) require supercomputing resources [55] | Precludes complex modeling on standard laboratory workstations |
| Data Format Standardization | Lack of industry-wide standards for sequencing data beyond simple text files [55] | Wastes time reformatting data; requires adaptation of tools to specific platforms |
Different computational problems impose distinct constraints on resources. Network-bound applications struggle with data transfer, disk-bound applications require distributed storage solutions, memory-bound applications need large RAM capacity, and computationally-bound applications demand powerful processors or specialized hardware accelerators [55]. Comparative genomics workflows using the COG database frequently encounter these limitations, particularly when analyzing thousands of bacterial genomes as now possible with the updated COG database covering 2,103 bacterial and 193 archaeal species [5].
Optimization Strategies and Computational Solutions
Efficient Orthology Analysis with COG Database
The COG database provides an optimized framework for functional annotation through its orthology-based classification system. The recently updated database (2024) includes 5,061 COGs derived from 2,296 organisms, with 6,266,336 genomic loci classified [5]. The COGNITOR program allows researchers to fit new protein sequences into existing COGs, leveraging pre-computed orthologous relationships to avoid computationally expensive de novo orthology inference [3].
Key advantages of the COG approach for computational efficiency:
- Pre-computed clusters: Eliminates the need for all-against-all sequence comparisons for each new analysis
- Stable identifiers: Replacement of deprecated gi numbers with RefSeq accessions ensures long-term usability [9]
- Functional categories: 17 well-defined functional categories enable rapid biological interpretation [3]
- Pathway groupings: New classifications for secretion systems and other pathways facilitate system-level analyses [5]
Workflow Optimization and Scalable Architectures
For analyses beyond standard COG annotation, several computational approaches can dramatically improve performance:
Cloud and Heterogeneous Computing: Leveraging cloud-based resources and specialized hardware accelerators can provide cost-effective access to high-performance computing without substantial capital investment [55]. This approach is particularly valuable for memory-bound applications such as weighted co-expression network construction.
Sparsified Genomics: A novel approach that systematically excludes redundant bases from genomic sequences to create shorter, more manageable sequences while maintaining analytical accuracy [56]. Implemented in tools like Genome-on-Diet, this method can accelerate read mapping by 2.57-6.28× and reduce index sizes by 2×, with comparable memory footprint and improved variation detection accuracy [56].
Optimized Orthogroup Inference: Methods such as those implemented in M1CR0B1AL1Z3R 2.0 use batch processing and representative sequence selection to enable analysis of up to 2,000 bacterial genomes—a six-fold increase over previous versions [57]. This server provides a "one-stop shop" for comparative analyses without requiring specialized bioinformatics expertise or infrastructure.
Integrated Computational Workflows
Tools like bacLIFE demonstrate how integrated workflows can streamline large-scale comparative genomics. This user-friendly framework combines genome annotation, comparative genomics, and prediction of lifestyle-associated genes using a Snakemake workflow manager [37]. By organizing the process into modular components—clustering using MCL and MMseqs2, lifestyle prediction with random forest models, and interactive visualization through a Shiny interface—bacLIFE reduces computational overhead while maintaining analytical robustness [37].
Figure 1: Optimized computational workflow for COG-based analysis showing key steps and optimization points (green).
Application Notes and Protocols
Protocol 1: Large-Scale Functional Annotation Using COG
Objective: Efficiently annotate protein-coding genes from multiple bacterial genomes using the COG database.
Materials and Reagents:
- High-performance computing cluster or cloud computing instance
- Protein sequence files in FASTA format
- COG database (download from NCBI)
- BLAST or MMseqs2 alignment software
Procedure:
- Data Preparation
- Ensure protein sequences meet quality standards
- Consolidate sequences from multiple genomes into a single query file
- Verify sequence headers contain unique identifiers
Sequence Alignment
- Run batch BLAST search against COG database:
- For larger datasets, use MMseqs2 for improved speed:
COG Assignment
- Process BLAST results using COGNITOR methodology [3]
- Apply threshold of three consistent best hits (BeTs) to assign proteins to COGs
- Manually review ambiguous assignments, particularly for COGs containing paralogs
Functional Interpretation
- Map COG assignments to functional categories
- Identify missing COGs in specific genomes that may indicate specialized adaptations
- Generate presence-absence matrices for comparative analyses
Computational Considerations:
- Parallelize BLAST searches across multiple cores
- For 1,000 bacterial genomes, allocate至少 64 GB RAM and 500 GB storage
- Use sparsified methods if computational resources are limited [56]
Protocol 2: Optimized Comparative Genomics for Lifestyle Association
Objective: Identify genes associated with specific bacterial lifestyles (e.g., pathogenicity) using computational optimization.
Materials and Reagents:
- bacLIFE workflow (available from GitHub)
- Genomic assemblies in FASTA format
- Pre-annotated lifestyle data for training
- R and Python environments
Procedure:
- Input Preparation
- Collect genomic assemblies for target organisms
- Reduce redundancy by clustering at 99% Average Nucleotide Identity (ANI)
- Annotate reference genomes with known lifestyles
Gene Cluster Analysis
- Run bacLIFE clustering module:
- This employs Markov Clustering (MCL) with MMseqs2 for efficient orthology detection [37]
Lifestyle Prediction
- Train random forest classifier using presence-absence matrices of gene clusters
- Validate model performance through cross-validation
- Apply model to uncharacterized genomes
Identification of Lifestyle-Associated Genes (LAGs)
- Statistical analysis of gene cluster distribution across lifestyles
- Prioritize candidate genes with strong association signals
- Validate predictions experimentally (e.g., through site-directed mutagenesis)
Computational Considerations:
- Use batch processing for datasets exceeding 500 genomes
- Allocate additional RAM for large MCL clustering operations
- Implement the workflow on high-performance computing infrastructure for largest datasets
Protocol 3: Sparsified Genomics for Efficient Sequence Analysis
Objective: Implement sparsified genomics techniques to accelerate large-scale sequence comparisons.
Materials and Reagents:
- Genome-on-Diet framework [56]
- Genomic sequences or reads in FASTA format
- Sufficient storage for original and sparsified sequences
Procedure:
- Pattern Selection
- Define repeating pattern sequence to determine which bases to exclude
- Balance exclusion rate with preservation of analytical accuracy
- Test multiple patterns on subset of data
Sequence Sparsification
- Run Genome-on-Diet with selected pattern:
- "1010" pattern example: includes bases at position 1, excludes position 2
Downstream Analysis
- Use sparsified sequences for alignment, mapping, or annotation
- Compare results with non-sparsified controls to validate accuracy
- Adjust sparsification parameters as needed
Performance Expectations:
- 2.57-6.28× acceleration for read mapping [56]
- 2× reduction in index size
- 54-75× faster containment search in large databases
Research Reagent Solutions
Table 2: Essential Computational Tools for Large-Scale Comparative Genomics
| Tool/Database | Primary Function | Computational Requirements | Application Context |
|---|---|---|---|
| COG Database [5] [3] | Protein functional classification | Moderate (web access or local installation) | Initial functional annotation; evolutionary studies |
| bacLIFE [37] | Lifestyle-associated gene prediction | High (HPC recommended for >100 genomes) | Linking genomic features to ecological adaptations |
| M1CR0B1AL1Z3R 2.0 [57] | Comprehensive genome comparison | Moderate to high (web server or local installation) | Phylogenomics; pangenome analyses |
| Genome-on-Diet [56] | Sequence sparsification | Moderate | Extreme-scale analyses; resource-limited environments |
| OrthoMCL [57] | Orthogroup inference | High for large datasets | Custom orthology analysis beyond COG coverage |
| DIAMOND [58] | Accelerated sequence alignment | Moderate (efficient memory use) | Rapid BLAST-like searches for large datasets |
Optimizing computational resources is no longer optional but essential for success in large-scale comparative genomics. The integration of established resources like the COG database with emerging technologies such as sparsified genomics and cloud computing creates a powerful framework for advancing bacterial genomics research. The protocols outlined here provide practical pathways for researchers to overcome computational barriers while maintaining scientific rigor.
Future developments in several areas promise to further alleviate computational constraints. Machine learning and artificial intelligence are revolutionizing protein function prediction [58], while continued refinement of sparse computation methods will enable analysis of increasingly large datasets [56]. The expansion of the COG database to include more protein families and improved annotations [5] [9] will enhance its utility for functional prediction. As these technologies mature, they will empower researchers to tackle increasingly complex biological questions about bacterial function, evolution, and ecology through computational means.
The functional categorization of bacterial genomes using the Clusters of Orthologous Genes (COG) database represents a cornerstone of modern microbial genomics. However, the reliability of these classifications is entirely dependent on the initial quality of gene predictions and subsequent annotation processes. Annotation errors, once introduced, can propagate extensively through databases, compromising downstream analyses including metabolic reconstructions, evolutionary studies, and drug target identification [3]. The exponential growth of genomic data—with approximately 4,000 microbial genomes now deposited daily into NCBI—has made rigorous quality control protocols more critical than ever [14]. This application note provides detailed methodologies for validating gene predictions within the context of COG-based functional categorization, integrating the latest advancements in annotation tools and databases to minimize error propagation and enhance research reproducibility for scientists and drug development professionals.
The COG Database: A Foundation for Functional Annotation
The COG database, originally created in 1997 and substantially updated in 2024, provides a phylogenetic classification of proteins from complete genomes based on orthology relationships [5] [9]. The current version encompasses 4,981 COGs derived from 2,103 bacterial and 193 archaeal genomes, typically with one representative genome per genus [9]. This extensive coverage makes COG an indispensable resource for functional annotation, particularly for newly sequenced bacterial genomes.
Orthologs, defined as genes in different species that evolved vertically from a common ancestor, typically retain the same function, making their identification crucial for reliable functional transfer [3]. The COG system employs a carefully validated procedure that identifies these orthologous relationships through sequence comparison and analysis of genome-specific best hits, followed by manual curation to ensure accuracy [3]. The database's construction involves detecting triangles of mutually consistent best hits and merging them into COGs, with subsequent manual analysis to eliminate false positives and identify multidomain proteins requiring special handling [3].
Table 1: Key Features of the Updated COG Database (2024 Release)
| Feature | Specification | Research Application |
|---|---|---|
| Total COGs | 4,981 | Core set for functional classification |
| Genome Coverage | 2,103 Bacteria, 193 Archaea | Broad phylogenetic representation |
| New Additions | Secretion systems (Types II-X), CRISPR-Cas, sporulation proteins | Study of pathogenesis, immunity, cellular differentiation |
| Annotation Depth | Updated references and PDB links | Enhanced functional predictions and structural insights |
| Availability | Web interface and FTP download | Flexible access for automated analysis |
Understanding common error sources is fundamental to developing effective quality control strategies. Annotation errors typically arise from several technical and biological challenges:
- Incorrect Gene Calls: Over-prediction or under-prediction of protein-coding genes remains a significant issue, particularly in automated annotation pipelines. Gene prediction algorithms may miss small genes, genes with atypical codon usage, or those located in genomic regions with unusual composition [14].
- Paralog Confusion: The misclassification of paralogs (genes related by duplication within a genome) as orthologs represents a frequent error. This is particularly problematic in large gene families where subtle sequence differences may correlate with functional specialization [3].
- Domain Fusion/Fission Errors: Multidomain proteins often create annotation challenges when individual domains belong to different COGs. Automated pipelines may incorrectly assign the entire protein to a single COG, leading to functional misannotation [3].
- Horizontal Gene Transfer (HGT): Genes acquired through HGT often exhibit atypical sequence composition that can confound both gene prediction and functional annotation algorithms. These genes may be misannotated or excluded from analysis despite their biological significance [19].
- Database Contamination: The propagation of initial annotation errors through public databases creates self-reinforcing error cycles that become increasingly difficult to identify and correct in subsequent annotations [3].
Integrated Workflow for Gene Prediction Validation
The following integrated workflow combines established tools with modern annotation systems to maximize annotation accuracy for COG categorization.
Figure 1: Comprehensive workflow for validating gene predictions prior to COG functional categorization, integrating multiple quality control checkpoints to minimize annotation errors.
Phase 1: Multi-Algorithm Gene Prediction
The initial phase employs multiple gene-finding algorithms to maximize prediction accuracy:
Protocol 1.1: Consensus Gene Calling
- Input: Assembled bacterial genome in FASTA format.
- Tools: Execute at least two complementary gene prediction tools:
- Prodigal: Run with
-cflag to closed ends, and-g 11for standard genetic code. - GeneMarkS-2: Execute with default parameters for bacterial genomes.
- BASys2 Annotation Pipeline: For rapid, comprehensive annotation including non-coding RNA elements [14].
- Prodigal: Run with
- Consensus Generation: Use AGUSTUS with
--uniqueGenes=trueto generate a non-redundant set of predictions from all callers. - Filtering: Remove predicted genes shorter than 90 nucleotides and those lacking plausible start/stop codons.
- Output: A high-confidence gene set in GFF3 and protein FASTA formats.
Protocol 1.2: Identification of Atypical Genetic Elements
- tRNA/rRNA Annotation: Use tRNAscan-SE and Barrnap with default parameters to identify structural RNA genes that may be misannotated as protein-coding genes [59].
- Horizontal Gene Transfer Detection: Apply SIGI (Score-based Identification of Genomic Islands) with codon usage analysis to identify regions with atypical sequence composition that may represent recent acquisitions [19].
- Phage/Plasmid Elements: Screen for mobile genetic elements using PhiSpy and PlasmidFinder to prevent misannotation of these often-atypical genes.
Phase 2: COG-Specific Validation Procedures
This phase focuses on ensuring accurate COG assignments through multiple validation steps.
Protocol 2.1: COG Assignment with COGNITOR
- Input: Validated protein sequences from Phase 1.
- Assignment: Use COGNITOR program with the three-best-hit cutoff to assign proteins to COGs. This stringent approach requires a protein to have at least three best hits to members of the same COG to be included, reducing false assignments [3].
- Validation: Manually inspect proteins assigned to COGs containing paralogs by constructing multiple sequence alignments (Clustal Omega) and neighbor-joining trees (MEGA) to verify orthology relationships.
- Domain Architecture Check: Use Pfam scan against Pfam-A database to verify domain composition matches expected architecture for the assigned COG [46].
Protocol 2.2: Phylogenetic Pattern Analysis
- Pattern Extraction: For each COG assignment, extract the phylogenetic pattern (distribution across species) from the COG database.
- Anomaly Detection: Flag assignments where the phylogenetic pattern significantly deviates from expectations based on taxonomic relationships.
- Context Validation: Verify that genes assigned to pathway-specific COGs (e.g., secretion systems Type II-X) have all necessary pathway components present in the genome [9].
Phase 3: Error Detection and Manual Curation
The final phase focuses on identifying and correcting residual errors.
Protocol 3.1: Automated Error Detection
- HGT Candidate Verification: For genes identified as potential horizontal transfers, perform additional validation using TIGER (Tool for Integrative Genome Element Recognition) with expanded taxonomic sampling.
- Multi-domain Protein Handling: For proteins matching multiple COGs, verify domain boundaries using SMART and CDD databases, then assign individual domains to appropriate COGs [3].
- Functional Consistency Check: Use BASys2's integrated pathway tools to verify that COG assignments produce metabolically coherent pathways [14].
Protocol 3.2: Strategic Manual Curation
- Priority Targets: Focus manual curation on: COGs with known functional diversity, proteins with discordant domain architectures, and genes from genomic islands.
- Literature Validation: For high-priority drug targets, perform comprehensive literature review focusing on experimental characterization of orthologs.
- Final Annotation: Document all manual overrides with justification in standard format for reproducibility.
Quantitative Quality Assessment Metrics
Establishing quantitative metrics is essential for standardized quality assessment across projects.
Table 2: Key Quality Metrics for COG Annotation Validation
| Metric Category | Specific Measurement | Target Value | Validation Method |
|---|---|---|---|
| Gene Prediction Quality | Agreement between multiple callers | >90% | BLASTP comparison, E-value <1e-10 |
| Percentage of genes with RBS | >85% | RBSfinder analysis | |
| COG Assignment Quality | Percentage of genome assigned to COGs | 56-83% (prokaryotes) | COGNITOR with 3-best-hit rule [3] |
| Phylogenetic pattern consistency | >95% | Taxonomic lineage check | |
| Functional Coherence | Metabolic pathway completeness | >80% | BASys2 pathway tools [14] |
| Domain architecture validation | >90% | Pfam/CDD domain analysis [46] | |
| Error Detection | Horizontal transfer identification | Context-dependent | SIGI with p-value <0.05 [19] |
| Paralog discrimination | >85% | Phylogenetic tree analysis |
Research Reagent Solutions
Table 3: Essential Research Reagents and Computational Tools for COG Annotation Quality Control
| Reagent/Tool | Specific Function | Application in Quality Control |
|---|---|---|
| COGNITOR Software | Assigns new proteins to existing COGs | Core COG assignment with configurable stringency [3] |
| BASys2 Annotation Pipeline | Rapid, comprehensive genome annotation | Independent validation of gene calls and functional annotations [14] |
| SIGI (Score-based Identification of Genomic Islands) | Identifies horizontally transferred genes | Detection of genes with atypical codon usage [19] |
| HMMER Suite | Profile hidden Markov model searches | Sensitive domain detection and remote homolog identification |
| CD-HIT | Clustering of protein sequences | Redundancy reduction before COG assignment [60] |
| Pfam Database | Protein family and domain classification | Validation of domain architecture in multidomain proteins [46] |
| eggNOG Database | Expanded orthologous groups | Complementary orthology resource with broader taxonomic coverage [46] |
| MetaGeneMark | Gene prediction in microbial genomes | Primary or confirmatory gene caller in consensus approach |
Robust quality control procedures for gene prediction validation are fundamental to reliable COG-based functional categorization of bacterial genomes. The integrated workflow presented here, combining multiple gene callers, stringent COG assignment criteria, and systematic error detection, provides a comprehensive approach to minimizing annotation errors. Implementation of these protocols will significantly enhance the reliability of downstream analyses, including identification of potential drug targets, reconstruction of metabolic pathways, and studies of bacterial evolution and pathogenesis. As genomic sequencing continues to expand, these quality control measures will become increasingly vital for maintaining the integrity and utility of public genomic databases.
Evaluating Predictive Power: Experimental Validation and Comparative Genomic Approaches
Application Note: Validating Biocontrol Potential inBacillus velezensisXY3
This application note details the integrated computational and experimental workflow used to validate the biocontrol potential of the endophytic bacterium Bacillus velezensis strain XY3 against the fungal pathogen Colletotrichum fructicola, the causative agent of tea anthracnose. The process bridges genomic prediction with phenotypic confirmation, providing a model for the functional characterization of bacterial genomes within the Clusters of Orthologous Groups (COG) framework [61].
From Genomic Prediction to Phenotypic Confirmation
The validation pipeline for strain XY3 proceeded sequentially from genome sequencing and in silico analysis to direct laboratory experiments.
Computational Predictions: Whole genome sequencing of XY3 revealed a 3.93 Mb circular chromosome with a GC content of 46.5%. In silico analysis identified 12 gene clusters responsible for secondary metabolite synthesis. Crucially, COG, GO, and KEGG analyses predicted a substantial genetic repertoire for the biosynthesis of antagonistic metabolites, including gene clusters for lipopeptides such as iturin, fengycin, and surfactin. Comparative genomics further identified unique genes related to lanthipeptide synthetase synthesis (e.g., ctg_01263 and ctg_01267), hinting at a broader antimicrobial capacity [61].
Experimental Validation: The computational predictions were directly tested through a series of phenotypic assays.
- Antifungal Activity: Confrontation assays demonstrated that XY3 fermentation broth significantly inhibits conidial germination and hyphal growth of C. fructicola.
- Mode of Action: Staining with propidium iodide and Hoechst confirmed that the antifungal activity compromises the membrane permeability of the fungal mycelium.
- Compound Identification and Validation: Crude lipopeptides were extracted from the fermentation broth, showing an EC50 value (effective concentration for 50% inhibition) of 21.33 µg mL⁻¹ against C. fructicola. LC-MS/MS analysis confirmed the presence of iturin A, fengycin A, and surfactin homologs. Subsequent plate assays with purified iturin and fengycin compounds verified their direct and notable inhibitory activity [61].
Summarized Quantitative Data
Table 1: Key Genomic and Phenotypic Data for Bacillus velezensis XY3
| Parameter | Result | Method / Notes |
|---|---|---|
| Genome Size | 3.93 Mb | Circular Chromosome [61] |
| GC Content | 46.5% | [61] |
| Gene Clusters | 12 | Secondary Metabolites [61] |
| EC50 of Lipopeptides | 21.33 µg mL⁻¹ | Against C. fructicola [61] |
| Key Antifungal Compounds | Iturin A, Fengycin A, Surfactin | Identified via LC-MS/MS [61] |
| Additional Trait | Produces Indole-3-acetic acid | Plant growth promotion potential [61] |
Experimental Workflow
The following diagram outlines the complete integrated workflow from genomic DNA to phenotypic confirmation.
Application Note: Functional Profiling ofLuoshenia tenuisfor Therapeutic Development
This note outlines the strategy for deciphering the functional potential of the gut commensal Luoshenia tenuis, a member of the Christensenellaceae family, through genomic analysis and experimental profiling. The goal is to assess its suitability as a Live Biotherapeutic Product (LBP) for metabolic diseases, demonstrating how COG-based functional categorization guides targeted phenotypic validation [62].
Strain Diversity and Functional Prediction
A genomic analysis of 27 strains of L. tenuis revealed significant intraspecies diversity.
- Genomic Features: Genome sizes ranged from 2.58 Mb to 2.77 Mb, with GC contents between 55.87% and 57.79% [62].
- Pan-Genome Analysis: The pan-genome was "open," comprising 6,659 orthologous genes. Of these, 1,546 (23.2%) were core genes, 2,456 (36.9%) were accessory genes, and 2,657 (39.9%) were strain-specific unique genes. This highlights considerable genomic plasticity [62].
- Horizontal Gene Transfer (HGT): Analysis identified 105 to 153 HGT events per strain, making up 3.76% to 5.55% of their genomes. COG functional annotation of these HGT genes showed enrichment in categories such as Energy production and conversion (C) and Cell wall/membrane/envelope biogenesis (M), indicating acquisition of potentially adaptive traits [62].
- Metabolic Predictions: In silico metabolic reconstruction predicted a capacity for metabolizing plant-derived carbohydrates and synthesizing various amino acids and cofactors [62].
Experimental Validation of Predicted Traits
Guided by genomic predictions, key phenotypes were validated in vitro.
- Acid Tolerance: Strains were validated for strong acid tolerance, a crucial trait for surviving passage through the stomach to function as an oral probiotic [62].
- Metabolite Production: Volatile metabolomics and bile acid transformation profiling confirmed the strain's ability to produce beneficial metabolites and extensively modify bile acids, providing a plausible mechanism for its positive impact on host metabolism observed in earlier mouse studies [62].
Summarized Genomic and Functional Data
Table 2: Genomic and Functional Characteristics of Luoshenia tenuis Strains
| Parameter | Findings | Significance / Method |
|---|---|---|
| Genome Size Range | 2.58 - 2.77 Mb | 27 sequenced strains [62] |
| GC Content Range | 55.87 - 57.79 % | [62] |
| Pan-Genome Size | 6,659 genes | Open state [62] |
| Core Genome | 1,546 genes (23.2%) | Conserved across all strains [62] |
| Unique Genes | 2,657 genes (39.9%) | Strain-specific adaptations [62] |
| HGT Events (per strain) | 105 - 153 (3.76 - 5.55% of genome) | COG-enriched in Categories C, M [62] |
| Validated Phenotype | Strong acid tolerance | Essential for oral probiotic [62] |
| Key Metabolic Output | Bile acid transformation | Linked to host metabolic health [62] |
Functional Profiling Workflow
The diagram below illustrates the process from strain collection to the functional validation of traits predicted by genomics.
Core Experimental Protocols
Protocol: Antifungal Activity Assay and Lipopeptide Validation
Principle: This protocol determines the efficacy of bacterial metabolites against fungal pathogens by measuring the inhibition of conidial germination and hyphal growth, and identifying the active compounds.
Materials:
- Pathogen: Colletotrichum fructicola culture.
- Antagonist: Bacillus velezensis XY3 culture.
- Growth Media: Potato Dextrose Agar (PDA), Luria-Bertani (LB) broth.
- Staining Solutions: Propidium iodide (PI) solution, Hoechst stain.
- Extraction Solvent: Hydrochloric acid (HCl) and Methanol.
- Analytical Instrument: LC-MS/MS system.
Procedure:
- Dual Culture Assay:
- Inoculate a fresh colony of XY3 on one edge of a PDA plate.
- Place a mycelial plug of C. fructicola on the opposite edge.
- Incubate at appropriate temperatures (e.g., 28°C) for 3-5 days.
- Measure the zone of inhibition between the two organisms.
Preparation of Fermentation Broth and Crude Lipopeptides:
- Inoculate XY3 in LB broth and incubate with shaking for 48-72 hours.
- Centrifuge the culture to collect the cell-free supernatant.
- Precipitate lipopeptides by acidifying the supernatant to pH 2.0 using HCl. Incubate overnight at 4°C.
- Centrifuge to pellet the crude lipopeptides and dissolve them in methanol.
Determination of EC50 Value:
- Prepare a series of dilutions of the crude lipopeptides.
- Mix each dilution with PDA medium and pour into plates.
- Inoculate the center of each plate with a C. fructicola mycelial plug.
- After incubation, measure the radial growth inhibition and calculate the EC50 value (e.g., 21.33 µg mL⁻¹) using statistical software.
Mode of Action via Membrane Integrity:
- Grow C. fructicola in liquid medium supplemented with XY3 fermentation broth.
- Collect the mycelia, wash, and stain with PI or Hoechst.
- Observe under a fluorescence microscope. Uptake of PI indicates loss of membrane integrity.
Compound Identification by LC-MS/MS:
- Analyze the crude lipopeptide extract using LC-MS/MS.
- Identify specific lipopeptides (e.g., Iturin A, Fengycin A, Surfactin) by comparing their mass spectra and retention times to standards.
Validation with Purified Compounds:
- Source or purify the identified lipopeptides.
- Repeat the antifungal activity assay (Step 3) using the purified compounds to confirm individual efficacy [61].
Protocol: Genomic-Driven Functional Profiling of Commensal Bacteria
Principle: This protocol uses whole-genome sequencing and pan-genome analysis to guide the experimental validation of predicted functional traits in bacterial commensals.
Materials:
- Bacterial Strains: Target strains (e.g., Luoshenia tenuis).
- DNA Extraction Kit: For high-quality, high-molecular-weight genomic DNA.
- Sequencing Platform: Long-read sequencer (e.g., PacBio) for complete genomes.
- Bioinformatics Software: For assembly, annotation, and pan-genome analysis (e.g., Prokka, Roary, HGT detection tools).
- Growth Media: Anaerobic broth and agar, Acidic media (e.g., pH 3.0), Bile acids.
- Analytical Instruments: GC-MS for volatile metabolomics, LC-MS for bile acid analysis.
Procedure:
- Genome Sequencing and Assembly:
- Extract genomic DNA from pure cultures.
- Sequence using a platform capable of generating long reads for complete, circularized genomes.
- Assemble the reads into a finished genome and check quality (completeness >92%, contamination <1%).
Pan-Genome and HGT Analysis:
- Annotate all genomes consistently to identify protein-coding genes.
- Perform pan-genome analysis to classify genes into core, accessory, and unique sets.
- Use specialized software to identify putative Horizontal Gene Transfer (HGT) events.
- Functionally annotate the core genome and HGT genes using the COG database.
Experimental Validation of Predicted Traits:
- Acid Tolerance Assay:
- Inoculate bacteria into broth adjusted to a low pH (e.g., pH 2.0 and 3.0).
- Incubate for a set period (e.g., 1-2 hours) simulating gastric transit.
- Plate on neutral pH agar to determine the survival rate via colony-forming unit (CFU) counts.
- Metabolite Profiling:
- Grow the strain in defined media.
- Extract volatile metabolites from the culture headspace or supernatant.
- Identify and quantify the metabolites using GC-MS.
- Bile Acid Transformation Assay:
- Supplement growth media with primary bile acids (e.g., cholic acid).
- Inoculate with the bacterial strain and incubate anaerobically.
- Extract metabolites from the culture supernatant and analyze via LC-MS to identify biotransformed bile acid species (e.g., secondary bile acids) [62].
- Acid Tolerance Assay:
The Scientist's Toolkit: Research Reagent Solutions
Table 3: Essential Reagents and Materials for Genomic Validation Studies
| Item | Function / Application | Example Use Case |
|---|---|---|
| LC-MS/MS System | High-sensitivity identification and quantification of specific metabolites, such as lipopeptides or bile acids. | Confirming the presence of iturin A and fengycin A in bacterial extracts [61]. |
| Propidium Iodide (PI) Stain | Fluorescent dye that enters cells with compromised membranes; used to assess cell viability and membrane integrity. | Visualizing the loss of membrane permeability in fungal hyphae treated with antifungal compounds [61]. |
| CRISPR-Cas9 Systems | For precise genome editing to create knockout mutants and validate gene function. | Knocking out a predicted biosynthetic gene cluster to confirm its role in metabolite production. |
| Anaerobic Chamber | Provides an oxygen-free environment for the cultivation of obligate anaerobic gut bacteria. | Culturing sensitive commensals like L. tenuis for functional studies [62]. |
| GC-MS (Gas Chromatography-Mass Spectrometry) | Separation and identification of volatile and semi-volatile organic compounds in a sample. | Profiling the volatile metabolites produced by gut microbes [62]. |
| COG (Clusters of Orthologous Groups) Database | Functional annotation of genomic sequences to predict the biological role of encoded proteins. | Categorizing the predicted proteome of a newly sequenced bacterium to hypothesize its functional capabilities [61] [62]. |
| Cell Painting Assay Kits | High-content, image-based profiling to assess morphological changes in cells treated with compounds. | Phenotypic screening in drug discovery to predict compound bioactivity [63]. |
Within the field of bacterial genomics, the functional categorization of genes is paramount for interpreting the metabolic capabilities, survival strategies, and ecological roles of microorganisms. The Clusters of Orthologous Groups (COG) database has long served as a foundational framework for this purpose, classifying genes based on evolutionary relationships. However, the landscape of functional databases has expanded significantly, offering specialized resources that complement and extend the COG framework. This analysis provides a detailed comparison of three pivotal databases—KEGG, eggNOG, and CAZy—situating them within the context of COG-based bacterial genome research. We outline their distinct architectures, annotation strengths, and practical applications, providing structured protocols for their use in concert to achieve a comprehensive functional profile of bacterial systems.
Quantitative Database Comparison
The following table summarizes the core structural and content characteristics of KEGG, eggNOG, and CAZy, highlighting their complementary natures.
Table 1: Key Characteristics of KEGG, eggNOG, and CAZy Databases
| Feature | KEGG | eggNOG | CAZy |
|---|---|---|---|
| Primary Focus | Biochemical pathways and molecular networks [64] | Hierarchical orthology and functional annotation [65] | Carbohydrate-Active Enzymes [66] |
| Core Unit | K number (KEGG Ortholog) [64] | Orthologous Group (OG) [67] | Protein Family (e.g., GH, GT, PL, CE, CBM) [68] |
| Taxonomic Scope | Broad (All domains of life) [64] | Very Broad (12,535 reference species) [65] | Broad (Bacteria, Eukaryota, Archaea, Viruses) [66] |
| Classification Structure | Pathway maps, BRITE hierarchies, Modules [64] | Hierarchical OGs across 1601 taxonomic levels [65] | Sequence-based families [68] |
| Annotation Sources | Manual curation & computational inference [64] | Integrated (GO, KEGG, CAZy, CARD, PFAM, etc.) [65] | Expert manual curation & sequence similarity [68] |
| Key Strengths | Pathway reconstruction and metabolic modeling [69] [64] | High-resolution orthology, broad functional annotation, phylogenetic analysis [69] [65] | Authoritative, experimentally-driven classification of CAZymes [66] [68] |
Database-Specific Profiles and Protocols
KEGG (Kyoto Encyclopedia of Genes and Genomes)
KEGG specializes in mapping genes and molecules to higher-order systemic functions, including metabolic pathways, regulatory networks, and biological modules. Its core functional unit is the KO (KEGG Orthology) entry, identified by a K number, which represents a group of orthologous genes associated with a specific molecular function within a network context [64]. A 2022 comparative study noted that KEGG's pathway-based organization is highly informative for medical and metabolic applications [69].
Table 2: Essential KEGG Analysis Tools
| Tool Name | Function | Typical Use Case |
|---|---|---|
| BlastKOALA | Automated K number assignment via BLAST search. | Initial functional annotation of a novel genome or metagenome-assembled genome (MAG). |
| KAAS | (KEGG Automatic Annotation Server) Provides KO assignments. | Annotation of multiple genomes simultaneously. |
| KEGG Mapper | Maps user-submitted K numbers onto pathway maps and BRITE hierarchies. | Visualizing the metabolic potential of an organism in the context of full pathways. |
Protocol 1: Metabolic Pathway Reconstruction with KEGG
- Objective: To identify and visualize the complete metabolic pathways present in a newly sequenced bacterial genome.
- Input: Assembled bacterial genome (FASTA format of nucleotide sequences or protein predictions).
- Procedure:
- Gene Prediction: If starting from a genome assembly, use a gene-calling tool (e.g., Prodigal for prokaryotes) to predict protein-coding sequences.
- KO Assignment: Submit the protein sequence file (FASTA) to the BlastKOALA web server. Select an appropriate prokaryotic reference genome set. The output will be a list of genes and their assigned K numbers.
- Pathway Mapping: Download the resulting K number list. Use the "Search Pathway" function in KEGG Mapper with this list to identify all pathways present in the genome. The tool will generate a color-coded map, highlighting enzymes that are present.
- Interpretation: Analyze the completed pathways (e.g., glycolysis, TCA cycle) to determine the organism's core energy metabolism. Identify absent pathway steps that may indicate auxotrophy for specific metabolites.
eggNOG (Evolutionary Genealogy of Genes: Non-supervised Orthologous Groups)
The eggNOG database provides a comprehensive framework for orthology prediction and functional annotation across a vast taxonomic space. Its orthologous groups (OGs) are computed hierarchically at over 1600 taxonomic levels, allowing for fine-grained resolution of orthology and paralogy relationships [65]. A 2022 evaluation found that eggNOG performs best among major databases regarding sequence redundancy and structural organization [69]. A key feature is its integration of diverse functional annotations from sources like Gene Ontology (GO), KEGG, CAZy, and the Comprehensive Antibiotic Resistance Database (CARD) into a single OG report [65].
Protocol 2: Functional Annotation of Metagenomic Data with eggNOG-Mapper
- Objective: To obtain a broad-spectrum functional annotation for genes predicted from a metagenomic sample.
- Input: Protein sequence file (FASTA) from a metagenomic gene catalog or metagenome-assembled genomes (MAGs).
- Procedure:
- Data Preparation: Compile all predicted protein sequences from your metagenomic analysis into a single FASTA file.
- Annotation with eggNOG-Mapper: Submit the FASTA file to the eggNOG-mapper web server. Select the "bacteria" taxonomic scope for a focused analysis or "all" for a broader search.
- Result Analysis: The server will return a table listing each query sequence, its best-matching OG, and transferred functional annotations, including COG categories, GO terms, K numbers, and CAZy families.
- Data Integration: Use the combined output to profile the overall functional potential of the microbiome, quantifying the abundance of genes involved in different COG functional categories and specific processes like carbohydrate metabolism (via CAZy annotations) or antibiotic resistance (via CARD annotations).
CAZy (Carbohydrate-Active EnZymes Database)
CAZy is a specialist database dedicated to the classification of enzymes that build, modify, and breakdown complex carbohydrates and glycoconjugates [66] [68]. Its classification is based on amino acid sequence similarities, which correlate strongly with enzyme mechanism and protein fold. CAZy families are exclusively created and populated based on experimentally characterized proteins, ensuring high annotation reliability [68]. The database covers several classes of catalytic and carbohydrate-binding modules:
- Glycoside Hydrolases (GHs): Hydrolyze glycosidic bonds.
- GlycosylTransferases (GTs): Form glycosidic bonds.
- Polysaccharide Lyases (PLs): Cleave glycosidic bonds via β-elimination.
- Carbohydrate Esterases (CEs): Remove ester-based modifications.
- Auxiliary Activities (AAs): Redox enzymes that act in conjunction with CAZymes.
- Carbohydrate-Binding Modules (CBMs): Promote adhesion to carbohydrates [66].
Protocol 3: Profiling the CAZyme Repertoire of a Bacterial Genome
- Objective: To identify and categorize all carbohydrate-active enzymes encoded within a bacterial genome.
- Input: Protein sequence file (FASTA) of a bacterial genome.
- Procedure:
- HMMER Search: Download the latest CAZy HMM profiles (from dbCAN2 or CAZy website). Use the
hmmscancommand from the HMMER suite to search the bacterial proteome against these profiles.- Example command:
hmmscan --domtblout output_file.dm dbcan.hmm protein_data.fasta
- Example command:
- Result Parsing: Parse the HMMER output using recommended domain coverage and e-value cutoffs (e.g., from the dbCAN2 meta-server) to assign CAZy family affiliations to each protein.
- Manual Curation (Optional): For high-impact studies, consider using CAZy's manual curation service, where experts provide the highest-quality analysis [66].
- Functional Inference: Summarize the counts of proteins in each GH, GT, PL, CE, AA, and CBM family. A high abundance of specific GH families (e.g., GH13 for starch degradation) can indicate the primary carbohydrate substrates the bacterium can utilize.
- HMMER Search: Download the latest CAZy HMM profiles (from dbCAN2 or CAZy website). Use the
Integrated Workflow for Functional Categorization
The databases are most powerful when used in an integrated workflow. A 2025 study on the Moringa oleifera rhizosphere microbiome exemplifies this, where COG analysis was integrated with enzymatic functions from KEGG, CAZy, and CARD to elucidate functional dynamics and energy metabolism [20]. The following diagram visualizes a typical integrated protocol for the comprehensive functional analysis of a bacterial genome.
The Scientist's Toolkit: Essential Research Reagents
The following table lists key computational tools and data resources essential for conducting the analyses described in this document.
Table 3: Key Research Reagents and Computational Tools
| Item Name | Type | Function in Analysis |
|---|---|---|
| Prodigal | Software | Predicts protein-coding genes in prokaryotic genomes [20]. |
| eggNOG-mapper | Web Server / Software | Provides fast functional annotation of novel sequences using precomputed orthologous groups [67]. |
| BlastKOALA | Web Server | Assigns KEGG Orthology (K) numbers to protein sequences for pathway reconstruction [64]. |
| HMMER Suite | Software | Used for profile Hidden Markov Model searches (e.g., for CAZy family assignment against HMM profiles) [68]. |
| MEGAN6 | Software | A tool for analyzing metagenomic data, capable of visualizing and comparing functional assignments from multiple databases like KEGG and eggNOG [69]. |
| CAZy HMM Library | Database | A collection of Hidden Markov Models for each CAZy family, used with HMMER to identify CAZymes in a protein set [68]. |
| KEGG Mapper | Web Tool Suite | Maps user-generated K number lists onto KEGG pathway maps to visualize systemic capabilities [64]. |
Assessing Horizontal Gene Transfer and Genomic Islands Using COG Patterns
The Clusters of Orthologous Groups (COG) database serves as an essential tool for phylogenetic classification of proteins across bacterial, archaeal, and eukaryotic genomes [3]. This application note demonstrates how COG functional categorization patterns can be leveraged to identify and characterize horizontal gene transfer (HGT) events and genomic islands (GIs) in bacterial genomes. HGT plays a crucial role in microbial evolution, facilitating the acquisition of adaptive traits such as antibiotic resistance, novel metabolic capabilities, and virulence factors [62] [70]. Genomic islands, as products of HGT, are clusters of genes in prokaryotic genomes that exhibit signatures of horizontal acquisition [70]. The COG database provides a robust framework for detecting these evolutionary events through comparative analysis of functional category distributions between core genomes and putative horizontally acquired regions.
Theoretical Foundation: COG Database and HGT Detection Principles
The COG Database Framework
The COG database was constructed through an exhaustive all-against-all sequence comparison of proteins from completely sequenced genomes, employing the criterion of consistency of genome-specific best hits to identify orthologous relationships [3]. The database comprises 2091 COGs that include 56-83% of gene products from each complete bacterial and archaeal genome [3]. COGs are classified into 17 functional categories that include metabolism, cellular processes, and signaling, as well as poorly characterized categories [3]. This systematic classification enables researchers to identify anomalies in functional category distributions that may indicate HGT events.
Genomic Islands as HGT Vehicles
Genomic islands are characterized by several distinctive features: sporadic distribution across strains, instability, sequence composition bias (particularly GC content divergence from host genome), atypical codon usage, large size, proximity to tRNA genes, and flanking direct repeats [70]. These mobile genetic elements frequently carry genes that enhance the host's adaptation to specific ecological niches, including pathogenicity, symbiosis, novel metabolic pathways, and resistance to antibiotics or heavy metals [70]. The integration of COG functional analysis with these structural features provides a powerful approach for GI identification and characterization.
Computational Protocols for COG-Based HGT Analysis
Protein Sequence Annotation Using COG Database
Objective: Assign functional categories to query protein sequences using the COG framework.
Materials:
- Protein sequence dataset in FASTA format
- Computational tools: BLAST+ suite, eggNOG-mapper [71]
- Reference database: COG database [3]
Procedure:
- Perform sequence similarity search using BLASTP against COG database with E-value cutoff of 1e-10 [3] [72]
- Identify consistent best hits across multiple genomes to establish orthology
- Apply COGNITOR program to fit new proteins into existing COGs based on the criterion of multiple genome-specific best hits [3]
- For enhanced accuracy, use eggNOG-mapper which employs precomputed orthologous groups and phylogenies to transfer functional information from fine-grained orthologs only [71]
- Assign COG functional categories to each successfully annotated protein
Interpretation: Proteins receiving COG annotations are classified into functional categories. Those that cannot be assigned to COGs may represent lineage-specific innovations or highly divergent acquired genes.
Identification of Genomic Islands
Objective: Detect putative genomic islands through sequence composition analysis and comparative genomics.
Materials:
- Complete genomic sequences in FASTA format
- IslandViewer4 web server [70]
- tRNAscan-SE 2.0 for tRNA gene detection [70]
Procedure:
- Submit genomic sequences to IslandViewer4, which integrates multiple prediction algorithms (IslandPick, IslandPath-DIMOB, SIGI-HMM, Islander) [70]
- Identify regions with significantly different GC content from genomic average
- Detect integration sites near tRNA genes using tRNAscan-SE 2.0
- Annotate flanking direct repeats (DRs) and integration sequences
- Extract predicted GI sequences for further analysis
Interpretation: Genomic regions exhibiting significantly different GC content, proximity to tRNA genes, and presence of mobility genes represent strong GI candidates [70].
COG Functional Profiling of Core Genome versus GIs
Objective: Compare COG functional category distributions between core genome and genomic islands to identify enrichment patterns indicative of HGT.
Materials:
- COG-annotated proteome
- Predicted genomic island coordinates
- Statistical analysis environment (R or Python)
Procedure:
- Separate protein sequences into two sets: core genome (excluding GIs) and GI-associated
- Calculate percentage distribution of COG categories for each set
- Perform statistical comparison (Chi-square test) to identify significantly enriched categories in GIs
- Focus analysis on COG categories V (Defense mechanisms) and X (Mobilome) which are directly associated with HGT and genome dynamics [70]
- Correlate COG enrichment patterns with known GI-associated functions
Interpretation: Significant enrichment of specific COG categories (e.g., mobility, defense, specialized metabolism) in GIs supports horizontal acquisition and identifies potential adaptive functions.
Application Example: COG Analysis in Luoshenia tenuis HGT Characterization
Experimental Framework
A recent study on Luoshenia tenuis, a gut commensal from Christensenellaceae family, demonstrated the application of COG analysis to characterize HGT events [62]. Researchers sequenced 27 complete genomes of L. tenuis and identified 105-153 HGT events per strain, constituting 3.76% to 5.55% of their genomes [62]. The COG functional annotation of horizontally transferred genes revealed enrichment in specific functional categories critical for environmental adaptation.
Quantitative Results of COG Analysis
Table 1: COG Functional Category Distribution in Horizontally Transferred Genes of Luoshenia tenuis
| COG Category | Code | Function | Enrichment in HGT genes | Biological Significance |
|---|---|---|---|---|
| Energy production and conversion | C | Metabolic pathways | High | Adaptation to nutrient availability |
| Cell wall/membrane/envelope biogenesis | M | Structural components | High | Host-environment interaction |
| Defense mechanisms | V | Resistance genes | Variable | Survival in competitive environments |
| Mobilome | X | Prophages, transposons | High | Self-mobility and further HGT |
| Unknown function | S | Uncharacterized | High | Potentially novel adaptations |
The COG analysis revealed that HGT genes in L. tenuis were predominantly enriched in pathways related to energy production and conversion (C), cell wall/membrane/envelope biogenesis (M), and other essential functions [62]. This enrichment pattern suggests that HGT has played a crucial role in the metabolic adaptation of this gut commensal to its ecological niche.
Experimental Validation
The bioinformatic predictions were complemented by experimental validation including acid tolerance assays and bile acid transformation profiling [62]. These experiments confirmed that the genes acquired through HGT indeed contributed to functional adaptations, such as enhanced survival in acidic environments and modification of bile acids, which potentially impact host metabolism [62].
Research Reagent Solutions
Table 2: Essential Research Reagents and Computational Tools for COG-Based HGT Analysis
| Reagent/Tool | Specific Function | Application Context | Source/Reference |
|---|---|---|---|
| COG Database | Orthologous group classification | Functional annotation of query sequences | [3] |
| eggNOG-mapper | Automated functional annotation | Fast annotation of novel sequences using orthology | [71] |
| IslandViewer4 | Genomic island prediction | Identification of HGT-derived genomic regions | [70] |
| BLAST+ Suite | Sequence similarity search | Identification of orthologous relationships | [3] [72] |
| Roary/Panaroo | Pangenome analysis | Differentiation of core and accessory genome | [73] |
| tRNAscan-SE 2.0 | tRNA gene detection | Identification of GI integration sites | [70] |
Workflow Visualization
Workflow for COG-Based HGT Analysis
Data Presentation and Statistical Analysis
Quantitative Data Summarization
When presenting COG-based HGT analysis results, structured tables are essential for clear data communication. The following elements should be included:
Table 3: Template for COG Category Distribution Summary
| COG Category | Core Genome (%) | GI Regions (%) | Enrichment Ratio | p-value |
|---|---|---|---|---|
| Category C | [Value] | [Value] | [Value] | [Value] |
| Category M | [Value] | [Value] | [Value] | [Value] |
| Category V | [Value] | [Value] | [Value] | [Value] |
| Category X | [Value] | [Value] | [Value] | [Value] |
| Category S | [Value] | [Value] | [Value] | [Value] |
Statistical analysis should include measures of confidence intervals for percentage distributions and chi-square factors to indicate significant deviations from random distributions [74]. For pangenome analyses, Heap's Law constants should be calculated to characterize pangenome openness using the formula n = κNγ, where n represents the number of pangenome genes and N is the number of genomes [73].
Visualization of COG Distribution Data
Histograms are recommended for displaying distributions of continuous quantitative data such as GC content differences between core genome and GIs [75]. For discrete data such as counts of genes in different COG categories, bar charts with appropriate binning strategies provide clear visualization [75]. The vertical axis should always start at zero to accurately represent frequency differences, and bin boundaries should be defined with one more decimal place than the source data to avoid ambiguity [75].
The integration of COG functional pattern analysis with genomic island prediction provides a powerful methodology for identifying and characterizing horizontal gene transfer events in bacterial genomes. This approach enables researchers to distinguish between vertically inherited core functions and horizontally acquired adaptive traits, offering insights into microbial evolution and environmental adaptation. The protocols outlined in this application note establish a standardized framework for COG-based HGT analysis that can be applied across diverse bacterial species, with particular relevance for understanding the genomic basis of pathogenicity, antibiotic resistance, and metabolic specialization.
The reconstruction of ancestral genomes represents a cornerstone of modern evolutionary genomics, providing a window into the genetic makeup of long-extinct ancestors. When integrated with functional classification systems like the Clusters of Orthologous Groups (COG) database, this approach transforms from mere historical curiosity into a powerful tool for deciphering functional evolutionary trajectories. The COG database, originally established in 1997 and continuously updated, offers a phylogenetic classification of proteins from complete genomes, systematically grouping orthologous proteins from bacteria, archaea, and eukaryotic species [9]. This framework enables researchers to trace the evolutionary history of gene families and functional systems across deep evolutionary timescales. Recent advances have dramatically expanded our capabilities, with new algorithms now enabling the reconstruction of hundreds of reference ancestral genomes across the eukaryotic kingdom [76]. These developments, coupled with innovative laboratory evolution techniques [77] and advanced visualization platforms [78], provide an unprecedented opportunity to explore the interplay between genome structure, function, and evolutionary adaptation, particularly in bacterial systems where the COG framework offers the most comprehensive coverage.
The COG Database: Foundation for Phylogenomic Analysis
Database Structure and Principles
The COG database implements a rigorous phylogenomic classification system based on the concept of orthology - the relationship between genes in different species that originate from a common ancestral gene and typically retain the same function throughout evolution. The database construction involves:
- All-against-all sequence comparison of proteins from completely sequenced genomes using gapped BLAST, followed by detection of paralogous groups within the same genome [3].
- Identification of triangles of mutually consistent, genome-specific best hits (BeTs) across distantly related genomes, which are then merged to form preliminary COGs [3].
- Manual curation and refinement to eliminate false positives, identify multidomain proteins, and split large groups containing distinct orthologous subgroups, ensuring accurate functional predictions [3].
The current version of COG (2025 update) encompasses 4,981 COGs derived from 2,296 species (2,103 bacteria and 193 archaea), typically with one representative genome per genus, substantially expanding from the previous 4,877 COGs and 1,309 species [9]. This expanded coverage captures nearly the full diversity of prokaryotic genera with completely sequenced genomes, providing a comprehensive platform for phylogenomic analysis.
Functional Categorization System
COGs are classified into 17 broad functional categories that facilitate the biological interpretation of genomic data. These categories include fundamental cellular processes such as translation, transcription, replication, metabolism, and cellular signaling, plus categories for poorly characterized proteins [16]. This systematic classification enables researchers to quickly assess the functional landscape of genomes and identify which biological subsystems are present, expanded, or absent in particular lineages.
Table 1: Key Functional Categories in the COG Database
| Category Code | Functional Category | Representative Functions |
|---|---|---|
| J | Translation | Ribosomal proteins, translation factors |
| K | Transcription | Transcription factors, RNA polymerase subunits |
| L | Replication and repair | DNA polymerase, nucleases, recombinases |
| D | Cell division | Chromosome partitioning, septum formation |
| M | Cell envelope biogenesis | Peptidoglycan synthesis, outer membrane proteins |
| C | Energy production | Electron transport, ATP synthesis |
| G | Carbohydrate metabolism | Glycolysis, pentose phosphate pathway |
| E | Amino acid metabolism | Amino acid biosynthesis and degradation |
| T | Signal transduction | Protein kinases, response regulators |
| S | Function unknown | Conserved proteins of unknown function |
Methodological Framework: Integrating COGs into Ancestral Genome Reconstruction
Algorithmic Approaches for Ancestral Reconstruction
The reconstruction of ancestral genomes has progressed from gene-centric to genome-scale approaches. The AGORA algorithm (Algorithm for Gene Order Reconstruction in Ancestors) represents a significant advance, enabling the reconstruction of detailed gene contents and organizations for hundreds of ancestral genomes [76]. AGORA operates through:
- Gene content inference using phylogenetic trees of extant genes to determine which genes were present in ancestral genomes.
- Pairwise genome comparison to identify orthologous genes that are adjacent and similarly oriented in multiple extant species, indicating conserved synteny.
- Graph-based assembly where nodes represent ancestral genes and edges represent supported gene adjacencies, with weights corresponding to the number of independent comparisons supporting each adjacency.
- Graph linearization through iterative removal of low-weight edges to produce a parsimonious reconstruction of the ancestral gene order.
This approach has been successfully applied to reconstruct 624 ancestral genomes across vertebrate, plant, fungi, metazoan, and protist lineages, with 183 of these representing near-complete chromosomal gene order reconstructions [76]. The method achieves 95.4% agreement with simulated benchmarks, outperforming other contemporary methods, particularly in handling gene duplications and complex evolutionary scenarios.
Experimental Validation Through Laboratory Evolution
Complementary to computational approaches, laboratory evolution experiments provide empirical validation of genome evolutionary dynamics. A recent breakthrough established a system to accelerate IS-mediated genome structure evolution in Escherichia coli by introducing multiple copies of a high-activity insertion sequence (IS1-YK2X8) [77]. This system enables real-time observation of genome structural changes that would normally require decades or centuries to occur in nature.
The experimental protocol involves:
- Engineering high-activity IS elements with corrected frameshifts in transposase genes, strong inducible promoters, and fluorescent markers for tracking.
- Evolving strains under relaxed neutral conditions that simulate the population dynamics of host-restricted endosymbionts and pathogens.
- Tracking accumulated mutations through whole-genome sequencing of evolved lineages.
Within just ten weeks, evolved strains accumulated a median of 24.5 IS insertions and underwent over 5% genome size changes, comparable to decades-long evolution in wild-type strains [77]. This experimental system provides crucial validation for computational predictions about genome reduction and structural evolution.
Diagram 1: Integrated workflow for phylogenomic analysis combining COG database and ancestral reconstruction
Application Notes: Protocol for Bacterial Evolutionary Genomics
Protocol: Reconstructing Ancestral Bacterial Genomes Using COG Framework
Objective: Reconstruct the gene content and organization of ancestral bacterial genomes and trace functional category changes over evolutionary time.
Materials and Reagents:
- High-quality genome assemblies for extant bacterial species of interest
- COG database (accessible at https://www.ncbi.nlm.nih.gov/research/COG)
- COGNITOR program or BLAST+ suite for sequence comparison
- AGORA algorithm implementation (standalone or via Genomicus platform)
- PhyloScape visualization platform (http://darwintree.cn/PhyloScape)
Step-by-Step Procedure:
Data Preparation and Orthology Assignment
- Download complete proteomes for all bacterial genomes to be analyzed
- Assign proteins to COGs using COGNITOR program with a minimum of three consistent best hits to establish orthology
- Manually verify ambiguous assignments by examining domain architecture and conserved sequence motifs
Gene Tree Construction and Reconciliation
- Generate multiple sequence alignments for each COG using appropriate tools (e.g., MUSCLE, MAFFT)
- Construct phylogenetic trees for each COG using maximum likelihood or Bayesian methods
- Reconcile gene trees with species tree to identify duplication and loss events
Ancestral Gene Content Reconstruction
- Map presence/absence patterns of COGs across the bacterial phylogeny
- Apply probabilistic models (e.g., Dollo, Maximum Parsimony) to infer ancestral gene content at each node
- Calculate confidence scores for each inferred ancestral gene
Ancestral Gene Order Reconstruction
- Extract gene order information from extant genomes, noting chromosomal positions and strand orientation
- Identify conserved synteny blocks shared across multiple genomes
- Apply AGORA algorithm to reconstruct ancestral gene orders using adjacencies supported by multiple pairwise comparisons
Functional Categorization and Analysis
- Map reconstructed ancestral genes to COG functional categories
- Quantify changes in functional category representation across evolutionary transitions
- Identify lineage-specific expansions or contractions of functional systems
Visualization and Interpretation
- Use PhyloScape platform to visualize phylogenetic trees with annotated COG categories
- Generate comparative synteny maps showing ancestral and extant genome organizations
- Create timeline visualizations of functional category changes across the phylogeny
Expected Results and Interpretation
Successful implementation should yield:
- Quantitative profiles of COG category representation in ancestral genomes
- Identification of key evolutionary transitions associated with major changes in functional capacity
- Lineage-specific adaptations reflected in expansions of particular functional categories
- Correlations between gene content changes and major phenotypic innovations
Table 2: Key Research Reagents and Computational Tools for Phylogenomic Analysis
| Resource Type | Specific Tool/Resource | Function and Application |
|---|---|---|
| Database | COG Database (2025) | Phylogenetic classification of proteins from 2,296 prokaryotic genomes |
| Annotation Tool | COGNITOR Program | Fits new protein sequences into existing COGs based on best-hit consistency |
| Ancestral Reconstruction | AGORA Algorithm | Reconstructs ancestral gene order and content using parsimony-based graph approach |
| Visualization Platform | PhyloScape | Interactive visualization of phylogenetic trees with metadata annotation |
| Laboratory Evolution System | IS1-YK2X8 E. coli Model | Accelerates observation of IS-mediated genome structure evolution |
| Data Resource | Genomicus Database | Repository of precomputed ancestral genomes for multiple clades |
Case Studies and Applications
Tracking the Evolution of Bacterial Secretion Systems
The COG database's recent expansion includes improved annotation of bacterial protein secretion systems (types II through X), enabling detailed evolutionary analysis of these critical virulence determinants [9]. By mapping secretion system COGs onto reconstructed ancestral genomes, researchers can:
- Determine the evolutionary origin and dissemination of different secretion system types
- Identify lineage-specific acquisitions and losses correlated with host adaptation
- Reconstruct the co-evolution of secretion systems and their regulatory networks
For example, analysis of Type III secretion systems (T3SS) across Gram-negative bacteria using this approach has revealed multiple independent acquisitions followed by extensive horizontal gene transfer, explaining the patchy phylogenetic distribution of this virulence system.
Experimental Validation: Laboratory Evolution of Genome Structure
The accelerated IS-mediated evolution system [77] provides empirical validation for computational predictions about genome reduction. Key findings include:
- Dynamic genome size changes with frequent small deletions and rare large duplications, updating the simplistic view of constant genome reduction under relaxed selection
- Rapid emergence of structural variants and composite transposons from high IS activity
- Quantification of fitness effects for different types of structural changes
This experimental system bridges computational predictions and empirical observation, providing a platform to test specific hypotheses about genome evolution generated from ancestral reconstructions.
Diagram 2: Iterative cycle of computational prediction and experimental validation in phylogenomics
Advanced Visualization and Data Integration
Modern phylogenomic analysis requires advanced visualization capabilities to interpret complex datasets. The PhyloScape platform addresses this need through [78]:
- Interactive tree visualization with customizable annotation systems
- Integration of multiple data types including geographic distributions, protein structures, and functional annotations
- Composable plug-in architecture allowing researchers to combine visualization components for specific analysis scenarios
- Scalable rendering of large trees through WebGL implementation, capable of handling hundreds of thousands of nodes
For bacterial phylogenomics, PhyloScape enables simultaneous visualization of phylogenetic relationships, COG functional categories, gene order information, and phenotypic metadata, facilitating the identification of correlations between genotype and phenotype evolution.
The integration of COG functional classification with ancestral genome reconstruction creates a powerful framework for investigating bacterial evolution at system-wide scale. This approach moves beyond single-gene studies to encompass complete functional systems and their co-evolution across deep timescales. The expanding COG database, coupled with sophisticated reconstruction algorithms like AGORA and advanced visualization platforms like PhyloScape, provides researchers with an unprecedented toolkit for deciphering evolutionary trajectories. Future directions will likely focus on incorporating additional data types, including gene expression patterns and protein-protein interactions, to create even more comprehensive models of ancestral cellular systems. As these methods continue to mature, they promise to reveal fundamental principles governing genome evolution and the emergence of biological complexity.
Benchmarking COG Performance Against Machine Learning Approaches like bacLIFE
Within the field of bacterial genomics, the functional categorization of genes is fundamental to understanding the genetic basis of bacterial lifestyles, such as pathogenicity or environmental benefit. For years, the Clusters of Orthologous Genes (COG) database has been a cornerstone for this purpose, providing a phylogenetic classification of proteins from diverse microbial genomes [5] [19]. However, the emergence of sophisticated machine learning (ML) frameworks, such as bacLIFE, presents a new paradigm for linking genomic features to phenotypic outcomes [37]. These Application Notes provide a structured comparison and detailed protocols for benchmarking the performance of the established COG database against modern ML approaches in the context of predicting bacterial lifestyle-associated genes (LAGs). This is critical for researchers and drug development professionals aiming to identify novel therapeutic targets or understand virulence mechanisms with the most efficacious tools.
Background and Key Concepts
The COG Database
The COG database is a well-established resource for the functional annotation of genes, built on phylogenetic classification of proteins from bacterial, archaeal, and eukaryotic genomes. COGs are comprised of individual orthologous genes or ortholog sets, where orthology is defined as genes descending from a common ancestral gene separated by a speciation event [5] [19]. The database's primary strength lies in its manual curation and its utility in identifying conserved, core genomic functions across the tree of life. Historically, COG analysis has been instrumental in categorizing gene functions within Genomic Islands (GIs) and quantifying horizontal gene transfer events, providing insights into microbial evolution and adaptation [19]. The most recent 2024 update includes genomes from 2,103 bacterial and 193 archaeal species, with 5,061 COGs cataloged [5].
Machine Learning Approaches: The bacLIFE Framework
bacLIFE represents a modern computational workflow that leverages comparative genomics and machine learning to predict bacterial lifestyles and identify LAGs. Its approach is fundamentally different from phylogeny-based classification. The tool operates through three integrated modules [37]:
- Clustering Module: Generates a database of functional gene families (gene clusters) from input genomes using Markov Clustering (MCL) and MMseqs2, moving beyond pre-defined orthologous groups.
- Lifestyle Prediction Module: Employs a random forest machine learning model on the absence/presence matrices of these gene clusters to forecast bacterial lifestyle (e.g., environmental, plant pathogen, animal pathogen).
- Analytical Module: Provides an interactive interface for users to explore results, visualize data, and pinpoint specific candidate LAGs based on their distinct patterns of presence and absence across lifestyles.
A key advantage of bacLIFE is its ability to analyze the "dark matter" of bacterial genomes—genes with unknown function—by learning the genomic signatures associated with different lifestyles from large-scale data [79] [80].
Table 1: Fundamental Characteristics of COG and bacLIFE
| Feature | COG Database | bacLIFE Framework |
|---|---|---|
| Primary Approach | Phylogenetic classification, manual curation | Machine learning, automated comparative genomics |
| Underlying Principle | Evolutionary conservation & orthology | Gene cluster distribution patterns & statistical association |
| Core Strength | Identifying conserved, core functions; evolutionary studies | Discovering novel LAGs, including genes of unknown function |
| Lifestyle Prediction | Not a direct function; inference based on annotated gene function | Direct prediction via a trained random forest model |
| Handling of Unknown Genes | Limited; relies on homology to known proteins | Central capability; can identify significant patterns for uncharacterized genes |
| Typical Output | Functional category assignment (e.g., COG class) | Lifestyle prediction & a list of predicted Lifestyle-Associated Genes (pLAGs) |
Quantitative Performance Benchmarking
Benchmarking Methodology
To objectively benchmark COG and ML performance, a robust framework is required. We propose a methodology inspired by large-scale ML benchmarking suites like the Penn Machine Learning Benchmark (PMLB), which emphasizes diverse, curated datasets and standardized evaluation metrics [81] [82]. The key steps involve:
- Dataset Curation: Assembling a diverse set of bacterial genomes with well-annotated lifestyles (e.g., plant pathogen, animal pathogen, environmental). Datasets should vary in meta-features such as genome size, taxonomic diversity, and class imbalance to avoid bias [81].
- Performance Metrics: Evaluating performance based on:
- Accuracy: The ability to correctly predict known lifestyles.
- Novel Discovery Rate: The proportion of validated LAGs identified that were previously unknown, measuring the power to explore genomic "dark matter."
- Generalizability: Performance on independently acquired data from novel species or strains, a known challenge in ML [83].
Performance Data from Case Studies
A case study on the Burkholderia/Paraburkholderia and Pseudomonas genera, involving 16,846 genomes, provides initial quantitative data on ML performance [37] [80]. While a direct, quantitative head-to-head comparison with COG analysis is not provided in the search results, the performance of bacLIFE can be used as a benchmark for ML approaches.
Table 2: Performance Metrics of bacLIFE from Case Studies
| Metric | Reported Performance | Experimental Context |
|---|---|---|
| Lifestyle Prediction Accuracy | Up to 90% (Burkholderia), 70-85% (Pseudomonas) | "Leave-one-species-out" cross-validation and PCoA clustering validation [37] [80]. |
| Predicted LAGs (pLAGs) Identified | 786 (Burkholderia), 377 (Pseudomonas) | Analysis focused on phytopathogenic lifestyle [37]. |
| Experimental Validation Success Rate | ~43% (6 out of 14 tested pLAGs validated) | Site-directed mutagenesis of predicted LAGs of unknown function, followed by plant bioassays [37]. |
| Identification of Known Virulence Factors | ~70% of pLAGs corresponded to known toxicity genes | In-silico comparison of pLAGs with known genes involved in plant toxicity, toxin release, and quorum sensing [80]. |
The ~43% experimental validation rate for genes of previously unknown function is particularly significant, demonstrating the power of ML to generate high-confidence hypotheses for experimental testing [37]. This contrasts with traditional, homology-based methods which would likely not have flagged these genes for investigation.
Experimental Protocols
Protocol 1: COG-Based Functional Categorization of Genomic Islands
1.1 Objective: To identify Genomic Islands (GIs) in a bacterial genome and characterize their functional content using the COG database.
1.2 Materials & Reagents:
- Computational Hardware: A standard desktop computer or server with internet access.
- Software: SIGI (Score-based Identification of Genomic Islands) or a comparable GI prediction tool [19].
- Database: The most recent COG database (available from the NCBI FTP site) [5].
1.3 Procedure:
- GI Prediction: Run the SIGI software on the target bacterial genome sequence. SIGI analyzes codon usage bias to distinguish putatively alien (pA) genes (horizontally acquired) from putatively native (pN) genes [19].
- COG Assignment: For every gene in the genome (both pA and pN sets), determine its corresponding COG classification by querying the COG database via the NCBI web interface or local BLAST search.
- Functional Categorization: Tally the COG classifications for the pA genes (located in GIs) and the pN genes separately.
- Data Analysis:
- Calculate the relative frequency of each COG functional category (e.g., Metabolism, Information Storage) within the pA and pN gene sets.
- Compute a ratio (r) for each COG category:
r(k) = f_k(pA) / f_k(pN), wheref_kis the frequency of category k. - Categories with
r(k) > 1are considered overrepresented in GIs, indicating a potential association with adaptive functions like pathogenicity [19].
Protocol 2: ML-Driven Lifestyle and LAG Prediction with bacLIFE
2.1 Objective: To predict the lifestyle of a bacterial genome and identify candidate Lifestyle-Associated Genes (LAGs) using the bacLIFE workflow.
2.2 Materials & Reagents:
- Computational Hardware: A Linux-based server is recommended for large-scale analyses.
- Software & Dependencies: Docker or Singularity, Python (>v3.7), R (>v4.0.0), and Snakemake.
- Workflow: The bacLIFE tool, installed from its GitHub repository (https://github.com/Carrion-lab/bacLIFE) [37].
- Input Data: The target bacterial genome(s) in FASTA format.
2.3 Procedure:
- Setup: Install bacLIFE and all its dependencies using the provided installation guide. This is facilitated by the Snakemake workflow manager.
- Clustering Module Execution: Run the first module of bacLIFE. This will automatically annotate the input genomes and perform an all-vs-all comparison of genes, clustering them into functional gene families (gene clusters) using Markov Clustering (MCL) and MMseqs2 [37].
- Lifestyle Prediction: Execute the second module. This will build an absence/presence matrix of the gene clusters across all genomes and apply the built-in random forest model to predict the lifestyle of the input genome(s) [37].
- LAG Identification: In the analytical module, use the interactive Shiny application to identify predicted LAGs (pLAGs). These are genes or gene clusters that show a distinct pattern of presence for a specific lifestyle while being largely absent in others.
- Experimental Validation (Follow-up):
- Select high-priority pLAGs, especially those with unknown function.
- Use site-directed mutagenesis to create knockout mutants of the target gene(s) in the wild-type bacterial strain.
- Conduct phenotypic bioassays (e.g., plant infection assays for phytopathogens) to compare the virulence of the mutant strain with the wild-type. A significant reduction in pathogenicity confirms the gene as a true LAG [37] [79].
Workflow Visualization
Diagram 1: A comparison of the COG-based analysis workflow and the machine learning workflow of bacLIFE.
The Scientist's Toolkit: Research Reagent Solutions
Table 3: Essential Materials and Tools for Benchmarking Experiments
| Item Name | Function / Description | Relevance to Protocol |
|---|---|---|
| SIGI Software | A computational tool for Score-based Identification of Genomic Islands based on codon usage [19]. | Protocol 1: Identifies putative horizontally acquired genes for subsequent COG analysis. |
| NCBI COG Database | A comprehensive resource of Clusters of Orthologous Genes used for functional annotation of protein sequences [5]. | Protocol 1: Provides the standard functional categories for classifying genes from GIs. |
| bacLIFE Workflow | A user-friendly computational workflow (Python/R/Snakemake) for genome analysis and prediction of LAGs [37]. | Protocol 2: The core ML framework for lifestyle prediction and LAG identification. |
| Markov Clustering (MCL) | An algorithm used within bacLIFE to cluster protein sequences into functional families based on sequence similarity [37]. | Protocol 2: Fundamental to the first module of bacLIFE for generating gene clusters. |
| Random Forest Model | A machine learning algorithm implemented in bacLIFE that uses gene cluster data to predict bacterial lifestyle [37]. | Protocol 2: The core predictive engine of the bacLIFE workflow. |
| Site-Directed Mutagenesis Kit | Laboratory reagents (e.g., PCR kits, plasmids) for creating targeted gene knockouts in bacterial strains. | Protocol 2 (Validation): Essential for experimentally validating the function of predicted LAGs. |
Conclusion
The COG database remains an indispensable tool for functional genomics, continually evolving through expansions like the 2024 update to encompass diverse microbial lineages and improved annotations. Its orthology-based framework provides reliable phylogenetic classification that supports accurate genome annotation, evolutionary studies, and identification of virulence mechanisms. For biomedical research, COG analysis enables systematic discovery of therapeutic targets by pinpointing essential pathogen functions and horizontally acquired virulence factors. Future directions will likely involve deeper integration with multi-omics data, enhanced visualization tools, and applications in microbiome research and antimicrobial development. As microbial genomics continues to expand, COG-based comparative analyses will remain fundamental for translating sequence data into biological insights with clinical relevance.
References
- 1. COGs - Clusters of Orthologous Groups - NCBI - NIH [https://www.ncbi.nlm.nih.gov/research/cog-project/]
- 2. Microbial genome analysis: the COG approach - PMC [https://pmc.ncbi.nlm.nih.gov/articles/PMC6781585/]
- 3. The COG database: a tool for genome-scale analysis of ... [https://pmc.ncbi.nlm.nih.gov/articles/PMC102395/]
- 4. The COG database: an updated version includes eukaryotes [https://bmcbioinformatics.biomedcentral.com/articles/10.1186/1471-2105-4-41]
- 5. COG - NCBI - NIH [https://www.ncbi.nlm.nih.gov/research/cog]
- 6. Principle of COG Functional Annotation Analysis [https://www.mtoz-biolabs.com/principle-of-cog-functional-annotation-analysis.html]
- 7. Q - NCBI - NIH [https://www.ncbi.nlm.nih.gov/research/cog/cogcategory/Q/]
- 8. COG database update 2024 - PMC [https://pmc.ncbi.nlm.nih.gov/articles/PMC11701660/]
- 9. COG - Database Commons [https://ngdc.cncb.ac.cn/databasecommons/database/id/37]
- 10. The COG database: an updated version includes eukaryotes [https://pmc.ncbi.nlm.nih.gov/articles/PMC222959/]
- 11. COG database update 2024 - PubMed - NIH [https://pubmed.ncbi.nlm.nih.gov/39494517/]
- 12. Function annotation [https://biosys.bgi.com/help/en/metagenomics/analytic/3-1-function-annotation.html]
- 13. Annotating an anvi'o contigs database with COGs – [https://merenlab.org/2016/10/25/cog-annotation/]
- 14. BASys2: a next-generation bacterial genome annotation ... [https://pmc.ncbi.nlm.nih.gov/articles/PMC12230659/]
- 15. How to Write a COG Functional Annotation Analysis [https://www.mtoz-biolabs.com/how-to-write-a-cog-functional-annotation-analysis-is-it-just-about-reporting-the-most-abundant-category.html]
- 16. The COG database: new developments in phylogenetic ... [https://pmc.ncbi.nlm.nih.gov/articles/PMC29819/]
- 17. COG Pathways - NCBI - NIH [https://www.ncbi.nlm.nih.gov/research/cog/pathways/]
- 18. Fast and robust estimate of bacterial genus novelty using ... [https://pubmed.ncbi.nlm.nih.gov/41256769/]
- 19. A comparative categorization of gene flux in diverse ... [https://www.sciencedirect.com/science/article/pii/S0888754305001540]
- 20. Comprehensive analysis of orthologous genes reveals ... [https://pmc.ncbi.nlm.nih.gov/articles/PMC11976380/]
- 21. COG0002 - NCBI - NIH [https://www.ncbi.nlm.nih.gov/research/cog/search/?query=COG0002]
- 22. NCBI Genomes FTP - NIH [https://www.ncbi.nlm.nih.gov/datasets/docs/v2/data-processing/policies-annotation/genomeftp/]
- 23. Download annotations [http://geneontology.org/docs/download-go-annotations/]
- 24. Progressing microbial genomics: Artificial intelligence and ... [https://www.sciencedirect.com/science/article/pii/S2666521225000559]
- 25. Anvi'o: an advanced analysis and visualization platform for ... [https://pmc.ncbi.nlm.nih.gov/articles/PMC4614810/]
- 26. Visualizing, Binning, and Refining of Metagenome- ... [https://bio-protocol.org/pdf/Bio-protocol4684.pdf]
- 27. Optimizing Bioinformatics Workflows: Why It Matters & ... [https://ardigen.com/optimizing-bioinformatics-workflows-why-it-matters-and-when-to-start-thinking-about-it/]
- 28. Custom Workflow Development [https://www.data-intuitive.com/services/workflow_development.html]
- 29. anvi-run-ncbi-cogs [https://anvio.org/help/main/programs/anvi-run-ncbi-cogs/]
- 30. Expanded microbial genome coverage and improved protein family... [https://pubmed.ncbi.nlm.nih.gov/25428365/]
- 31. 05. COG注释- 杭州市疾控中心测序实验室 [https://indexofire.github.io/pathongs/book/C03_Genome-Annotation/05_cog/]
- 32. Functional Profiles of Phyllosphere and Rhizosphere ... [https://pmc.ncbi.nlm.nih.gov/articles/PMC12264086/]
- 33. Metagenomic analysis to identify unique microbes in the ... [https://www.nature.com/articles/s41598-025-87889-6]
- 34. — Metagenomics Workshop SciLifeLab... Functional annotation [https://2014-5-metagenomics-workshop.readthedocs.io/en/latest/comparative-functional-analysis/annotation.html]
- 35. 收藏!分享10个基因功能注释的数据库 [http://www.igenebook.com/wdoc_28863999.html]
- 36. 微生物基因组COG分类注释 - 密码子·生信云 [http://cloud2.mimazi.net:9001/tool/article-103.html]
- 37. bacLIFE: a user-friendly computational workflow for ... [https://www.nature.com/articles/s41467-024-46302-y]
- 38. DAVID Functional Annotation Bioinformatics Microarray Analysis [https://davidbioinformatics.nih.gov/]
- 39. FunMappOne: a tool to hierarchically organize and visually ... [https://bmcbioinformatics.biomedcentral.com/articles/10.1186/s12859-019-2639-2]
- 40. Functional and evolutionary implications of gene orthology [https://pmc.ncbi.nlm.nih.gov/articles/PMC5877793/]
- 41. Orthologs, paralogs and genome comparisons [https://pubmed.ncbi.nlm.nih.gov/10607614/]
- 42. 直系同源基因(orthologous gene)和旁系 ... [https://blog.csdn.net/newbie6901/article/details/95273490]
- 43. 同源性(homology)相关概念 - 生信技工 [https://yanzhongsino.github.io/2021/06/23/concept_homology/]
- 44. Testing the Ortholog Conjecture with Comparative Functional ... [https://journals.plos.org/ploscompbiol/article?id=10.1371/journal.pcbi.1002073]
- 45. 基因组分析中多物种同源基因的鉴定和筛选 [https://cloud.tencent.com/developer/article/1036695]
- 46. Metagenomics Functional : Key to... - CD Genomics Annotation [https://www.cd-genomics.com/microbioseq/resource-metagenomic-functional-annotation.html]
- 47. — Bioinformatics and Systems Biology Functional categories [https://www.uni-giessen.de/de/fbz/fb08/Inst/bioinformatik/software/EDGAR/Features/functional_categories]
- 48. Deep-learning-based single-domain and multidomain ... [https://www.nature.com/articles/s41587-025-02654-4]
- 49. Gene3D: Multi-domain annotations for protein sequence ... [https://pmc.ncbi.nlm.nih.gov/articles/PMC3965083/]
- 50. Genomic Sequence, Splicing, and Gene Annotation - PMC [https://pmc.ncbi.nlm.nih.gov/articles/PMC1287883/]
- 51. Annotating the genome at single-nucleotide resolution with ... [https://www.nature.com/articles/s41592-025-02881-2]
- 52. Comparative genomics reveals key adaptive mechanisms ... [https://www.frontiersin.org/journals/microbiology/articles/10.3389/fmicb.2025.1543610/full]
- 53. moshi4/COGclassifier: A tool for classifying ... [https://github.com/moshi4/COGclassifier]
- 54. Comparative genomics: a key tool in bacterial research [https://efor-group.com/en/comparative-genomics-bacterial-research/]
- 55. Computational solutions to large-scale data management and ... [https://pmc.ncbi.nlm.nih.gov/articles/PMC3124937/]
- 56. Taming large-scale genomic analyses via sparsified ... [https://www.nature.com/articles/s41467-024-55762-1]
- 57. M1CR0B1AL1Z3R 2.0: an enhanced web server for ... [https://pmc.ncbi.nlm.nih.gov/articles/PMC12230721/]
- 58. Deciphering bacterial protein functions with innovative ... [https://www.sciencedirect.com/science/article/abs/pii/S0966842X24003160]
- 59. Chromosome-level genome assembly and annotation of ... [https://www.nature.com/articles/s41597-025-06029-x]
- 60. Comprehensive analysis of orthologous genes reveals ... [https://link.springer.com/article/10.1007/s10142-025-01580-7]
- 61. Genome sequencing and experimental validation reveal ... [https://www.sciencedirect.com/science/article/pii/S1049964425002026]
- 62. Genomic insights and metabolic profiling of gut commensal ... [https://pmc.ncbi.nlm.nih.gov/articles/PMC12325933/]
- 63. Predicting compound activity from phenotypic profiles and ... [https://www.nature.com/articles/s41467-023-37570-1]
- 64. KO (KEGG ORTHOLOGY) Database [https://www.genome.jp/kegg/ko.html]
- 65. eggNOG 6.0: enabling comparative genomics across 12 ... [https://pmc.ncbi.nlm.nih.gov/articles/PMC9825578/]
- 66. CAZy - Home [https://www.cazy.org/]
- 67. EGGNOG Automatic Classification based on COG categories [https://microscope.readthedocs.io/en/3.17.5/content/genomic/classifEGGNOG.html]
- 68. The Carbohydrate-Active EnZymes database (CAZy) [https://pmc.ncbi.nlm.nih.gov/articles/PMC2686590/]
- 69. Comparison of functional classification systems - PMC [https://pmc.ncbi.nlm.nih.gov/articles/PMC9713901/]
- 70. The environmental adaptation of acidophilic archaea [https://bmcgenomics.biomedcentral.com/articles/10.1186/s12864-025-11875-5]
- 71. EGGNOG Automatic Classification based on COG categories [https://microscope.readthedocs.io/en/3.17.0/content/genomic/classifEGGNOG.html]
- 72. Genomic functional annotation using co-evolution profiles of ... [https://genomebiology.biomedcentral.com/articles/10.1186/gb-2002-3-11-research0060]
- 73. Benchmarking pangenome dynamics and horizontal gene ... [https://www.frontiersin.org/journals/microbiology/articles/10.3389/fmicb.2025.1537826/full]
- 74. Part 2: Data Tables and Charts [https://www.clir.org/pubs/reports/pub122/part2/]
- 75. 11 Summarising quantitative data | Scientific Research and ... [https://bookdown.org/pkaldunn/SRM-Textbook/SummariseQuantData.html]
- 76. Reconstruction of hundreds of reference ancestral ... [https://www.nature.com/articles/s41559-022-01956-z]
- 77. Laboratory evolution of the bacterial genome structure ... [https://pmc.ncbi.nlm.nih.gov/articles/PMC12065110/]
- 78. PhyloScape: interactive and scalable visualization platform for ... [https://bmcbioinformatics.biomedcentral.com/articles/10.1186/s12859-025-06203-3]
- 79. A computational tool that will transform bacterial genome ... [https://www.universiteitleiden.nl/en/news/2024/04/a-computational-tool-that-will-transform-bacterial-genome-analysis]
- 80. bacLIFE: How AI distinguishes the good from the bad and ... [https://nioo.knaw.nl/en/news/baclife-how-ai-distinguishes-the-good-from-the-bad-and-the-ugly]
- 81. PMLB: a large benchmark suite for machine learning evaluation and comparison | BioData Mining | Full Text [https://biodatamining.biomedcentral.com/articles/10.1186/s13040-017-0154-4]
- 82. GitHub - EpistasisLab/pmlb: PMLB: A large, curated repository of benchmark datasets for evaluating supervised machine learning algorithms. [https://github.com/EpistasisLab/pmlb]
- 83. Benchmarking the generalizability of brain age models [https://pmc.ncbi.nlm.nih.gov/articles/PMC9875922/]